Bitcoin may be mirroring bearish 2014 fractal; are further losses imminent?

Cover art/illustration via CryptoSlate. Image includes combined content which may include the use of AI tools.
Much to the chagrin of Bitcoin’s bulls, the cryptocurrency has remained in a firm downtrend over the past several weeks, which has now resulted in BTC pushing up against its key near-term support level, with a break below this price opening the gates to significantly further losses.
Interestingly, one prominent crypto-focused analyst is now noting that Bitcoin’s recent price action is strikingly similar to that seen during the 2014-2015 bear market, which could mean that it will see significantly further losses in the coming weeks and months before it establishes a long-term bottom.
Bitcoin plummets below $7,000 – will bulls defend this key support level?
At the time of writing, Bitcoin is trading down over 7 percent at its current price of $6729, which marks a massive drop from its weekly highs of nearly $9,000 and a significant extension of the bearish momentum that was sparked when it failed to stabilize over $10,000 in late-October.
Bitcoin has found notable support within the upper-$6,000 region over the past couple of days, but it remains unclear as to whether this support will still exist as BTC tests this level again in the coming hours and days.
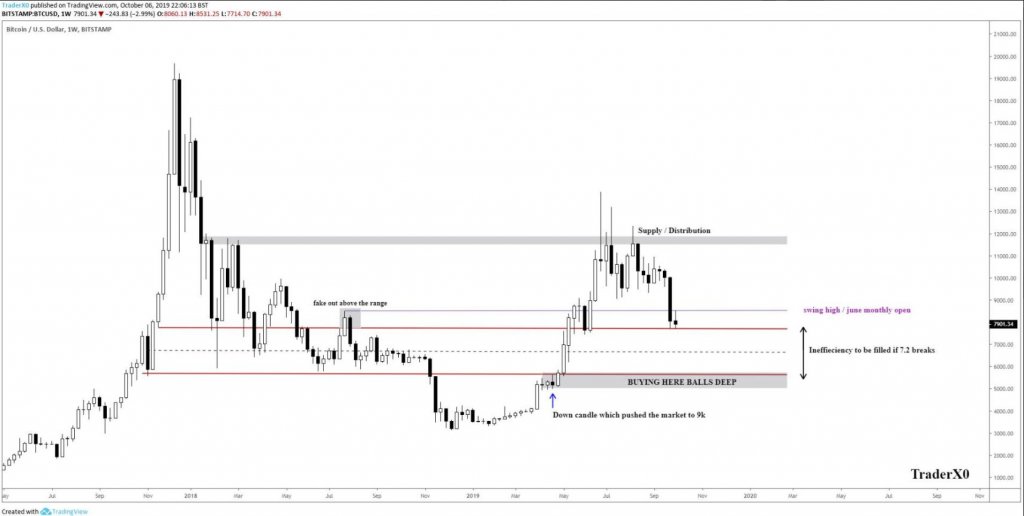
TradeX0, a popular cryptocurrency analyst on Twitter, explained in a recent tweet that he believes BTC is positioned for a movement to the $5,000 region in the near-term, which is where its next major support level exists. He noted while referencing the chart seen below:
“$BTC – Weekly Outlook: 7 weeks in and the 5k levels I believed price would trade at looks to be coming to fruition. Looking for any significant swing shorts around the low to mid 7's – before trading towards the range lows and fill in the inefficient gap,”
Does a fractal pattern from 2014 spell trouble for BTC?
Further adding to Bitcoin’s current bearishness is the possibility that it is currently expressing price action strikingly similar to that seen during the 2014 bear market, which could mean that significantly further losses are imminent.
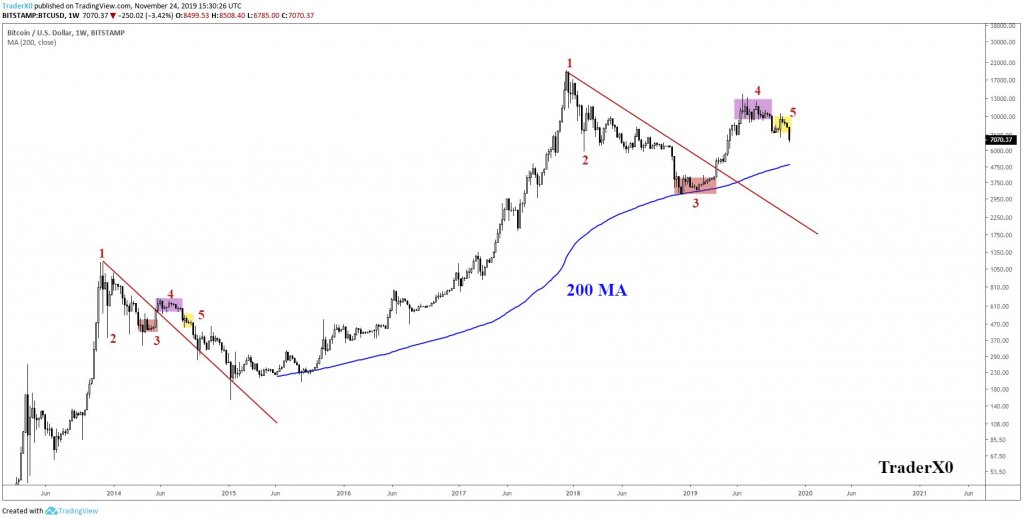
TraderX0 also spoke about this possibility in a tweet, telling his followers that there are clear similarities between the cryptocurrency’s current price action and that seen several years ago, which could spell trouble for where it heads next.
“$BTC – Yeah probably was nothing… Dont worry about it,” he sarcastically quipped while comparing the similarities between crypto’s price action over the two time periods in the chart below.
If Bitcoin continues dropping lower in the near-term, it is highly probable that it will face further selling pressure in the coming months before it establishes a long-term bottom.