Explaining the big Bitcoin drop: BTC network stats and technical analysis

Cover art/illustration via CryptoSlate. Image includes combined content which may include the use of AI tools.
Over $20 billion have been wiped off Bitcoin’s market cap in the last few days. The flagship cryptocurrency went from trading around $8,000 on Wednesday to a low of $6,800 today. As the sell-off continues, IntoTheBlock believes that several blockchain analytics factors can explain this drop. Meanwhile, CryptoSlate takes a technical approach.
Bitcoin blockchain analytics
In a blog post, the chief technical officer at IntoTheBlock, Jesus Rodriguez, explained different blockchain patterns, based on the company’s statistical models, that portray an idea about the downturn in the market and where it could be heading next. He stated that blockchain activity could provide insights about what is currently happening and offer clues about the near term future.
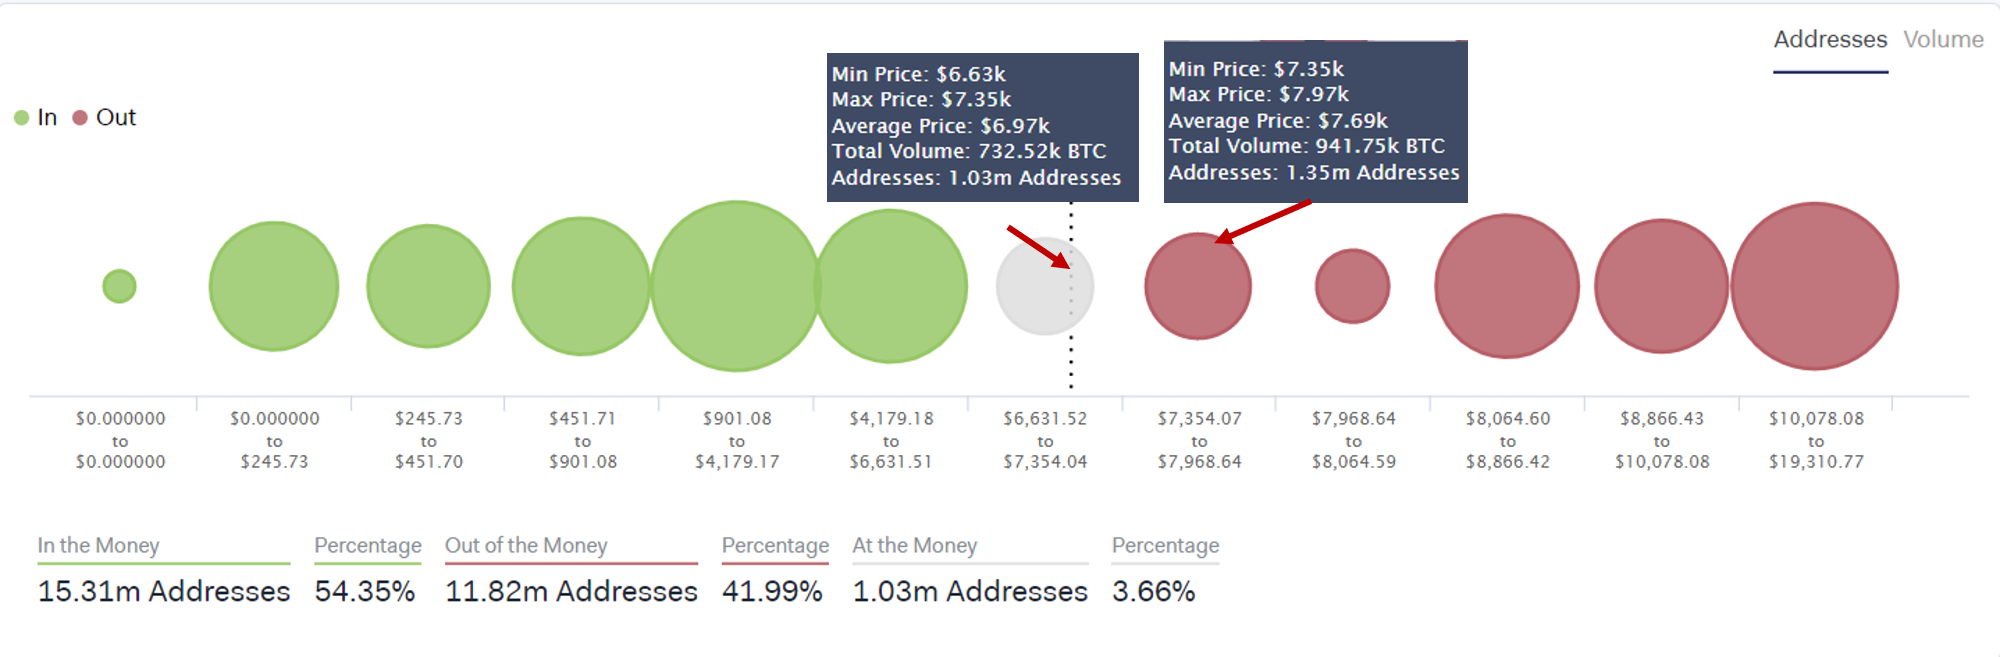
According to Rodriguez, the “In/Out Money” model considers the distribution of Bitcoin throughout individual wallets based on the current price. Based on this representation, there are 1 million addresses with balances between $6,600 and $7,350 containing 730,000 BTC, which could serve as support. But, if the sell-off continues, the next significant level of support sits around $4,200 and $6,600, with over 3.6 million addresses carrying nearly 2 million BTC.
On the upside, there is a certain level of resistance between $7,350 and $7,970, since 1.4 million addresses are holding 941,000 BTC. However, the strong resistance level sits between $8,000 and $8,800, with 3 million addresses containing 1.9 million BTC.
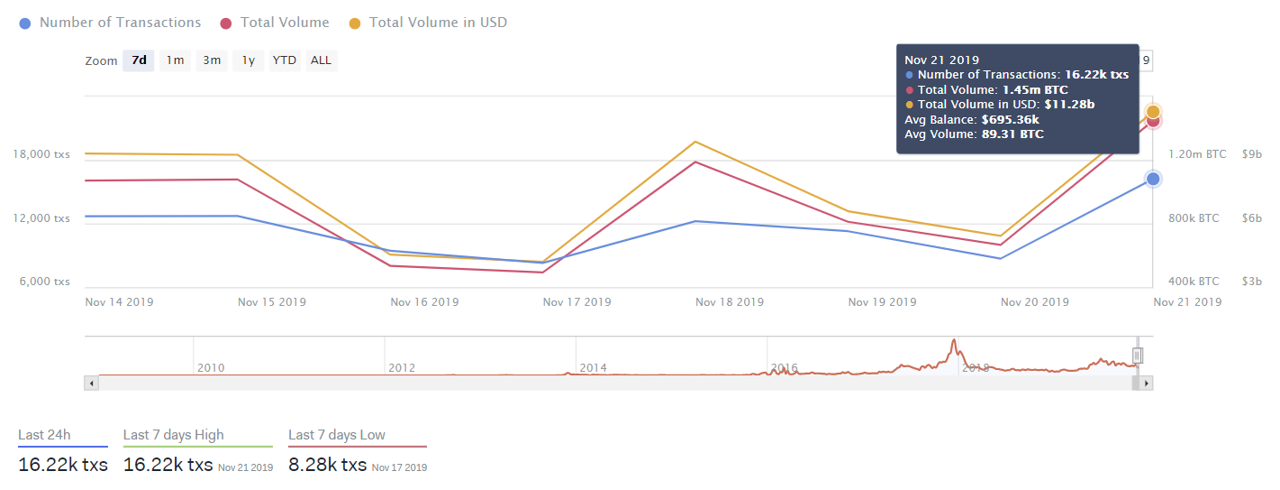
Even though Bitcoin plunged over 22 percent since last week, the number of Large Transactions with a value of $100,000 or higher has been relatively steady. On Nov. 14, there were almost 13,000 large transactions on the network, while today, there are over 16,000. Rodriguez believes that this is a signal of “confidence and trading activity.”
This level of “confidence and trading activity” appears to be coming mainly from the western market. Nearly 55 percent of the Bitcoin volume was traded from 10:01 AM to 10:00 PM (UTC), which represents the West.
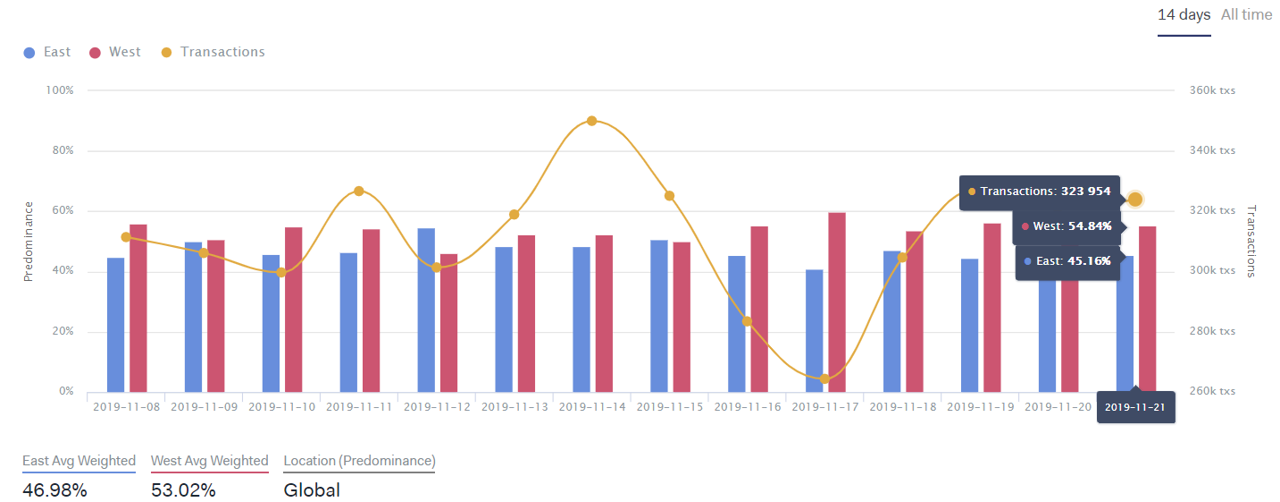
Meanwhile, the eastern market has refrained from trading Bitcoin and moved into stablecoins, such as Tether. This is common during significant retracement in the market as investors look to protect their capital from declining prices.
China’s efforts to “regulate, control, and clamp down cryptocurrency trading” across the nation could also affect the eastern trading activity. As a result, almost 54 percent of Asian investors have moved into stablecoins.

BTC technical analysis
The analysis provided by IntoTheBlock’s CTO appears to coincide with what can be seen from a technical perspective on the Bitcoin’s price charts.
Based on the 1-week chart, for instance, the recent drop was anticipated by a descending parallel channel that is developing under this time frame since the week of June 24. Since then, every time BTC reaches the bottom of the channel, it bounces off to the middle or the top. But, when it reaches the top, it falls back to the middle or the bottom.
Bitcoin is now hitting the bottom of the channel at $6,900 once again after retracing from reaching the top on Oct. 26. If this technical formation continues to contain the price of Bitcoin as the current support level is backed by 1 million addresses holding 730,000 BTC, then a rebound to the middle or top of the channel is very likely.

TD sequential indicator also adds credibility to the idea of a bounce off current levels. This technical index recently presented a buy signal in the form of a red nine candlestick on both the 1-day and the 12-hour chart. If validated, Bitcoin could rise one to four candlesticks or start a new bullish countdown. A green two candlestick trading above a preceding green one candle could serve as confirmation for an upturn.
If Bitcoin is indeed bound for an upswing, it will face stiff resistance around the 50 percent Fibonacci retracement level. This is also the area where Rodriguez sees 3 million addresses containing 1.9 million BTC, which could put pressure on a potential bullish impulse.

It is worth noting that if Bitcoin can break through this resistance cluster, then it would probably resume the uptrend that began earlier this year. This is considering that the descending parallel channel on the 1-week chart is part of a bull flag. The move that took the pioneer cryptocurrency to nearly $14,000 created the flagpole. And, the current consolidation period is developing the flag.
This continuation pattern could result in a breakout in the same direction of the previous trend. By measuring the height of the flagpole, the bull flag estimates a 76.5 percent target to the upside. If validated, Bitcoin could rise to $15,000.
Nevertheless, closing below the 65 percent Fibonacci retracement level around $6,900 could invalidate the bullish outlook. If this happens, Bitcoin could push downwards to the 70 or 88.6 percent Fibonacci retracement, between $6,400 and $4,400. As Rodriguez explained, this area could pose a significant level of support, as there are 3.6 million addresses carrying nearly 2 million BTC.
Moving forward
The recent price action that Bitcoin experienced brought out extremely pessimistic views about the future of Bitcoin. Mark Dow, a former US Treasury and International Monetary Fund economist, believes that BTC is “dying.” Additionally, the overall market sentiment turned into “extreme fear,” according to the Crypto Fear and Greed Index (CFGI).
Despite the bearish feeling among investors, Warren Buffett once said:
“Be fearful when others are greedy and greedy when others are fearful.”
Based on historical data, every time the CFGI goes into “extreme fear,” a buying opportunity is presented. Meanwhile, the network statistics and technical analysis previously presented estimate strong support around the current levels. Now, it remains to be seen if Bitcoin would be able to rebound or continue falling to the next level of support around $6,400 or lower.