 Bitcoin bounces back above $8,500; will it continue the uptrend?
 Bitcoin bounces back above $8,500; will it continue the uptrend?

Cover art/illustration via CryptoSlate. Image includes combined content which may include AI-generated content.
Bitcoin is back above the $8,500 barrier signaling a potential further advance. On Jan. 19, Bitcoin reached a yearly high of $9,170. The milestone served as a take profit point for many investors triggering a retracement.
Since then, the flagship cryptocurrency pulled back 10 percent to hit a low of $8,250 on Jan. 24. This price level is where the 128-four-hour moving average sits, which was able to hold BTC from a further correction. As a result, Bitcoin bounced off this price hurdle gaining over 3 percent of the value it had lost.
The recent upswing allowed Bitcoin to break above the 100-four-hour moving average, based on the 4-hour chart. A further increase in the buying pressure behind the pioneer cryptocurrency could result in a retest of the 50-four-hour moving average that sits at $8,670.
Nevertheless, a falling wedge appears to be developing under the same time frame. This technical formation signals a price reversal from bearish to bullish, but Bitcoin could still make a lower low before breaking out of this pattern.
Thus, BTC could retest the 128-four-hour moving average. If demand picks up around this level, then this cryptocurrency could try to retest the $9,000 resistance zone.
Closing below the 128-four-hour moving average, however, could signal a steeper decline to the 200-four-hour moving average. This level of support sits around $7,900.
Moving forward
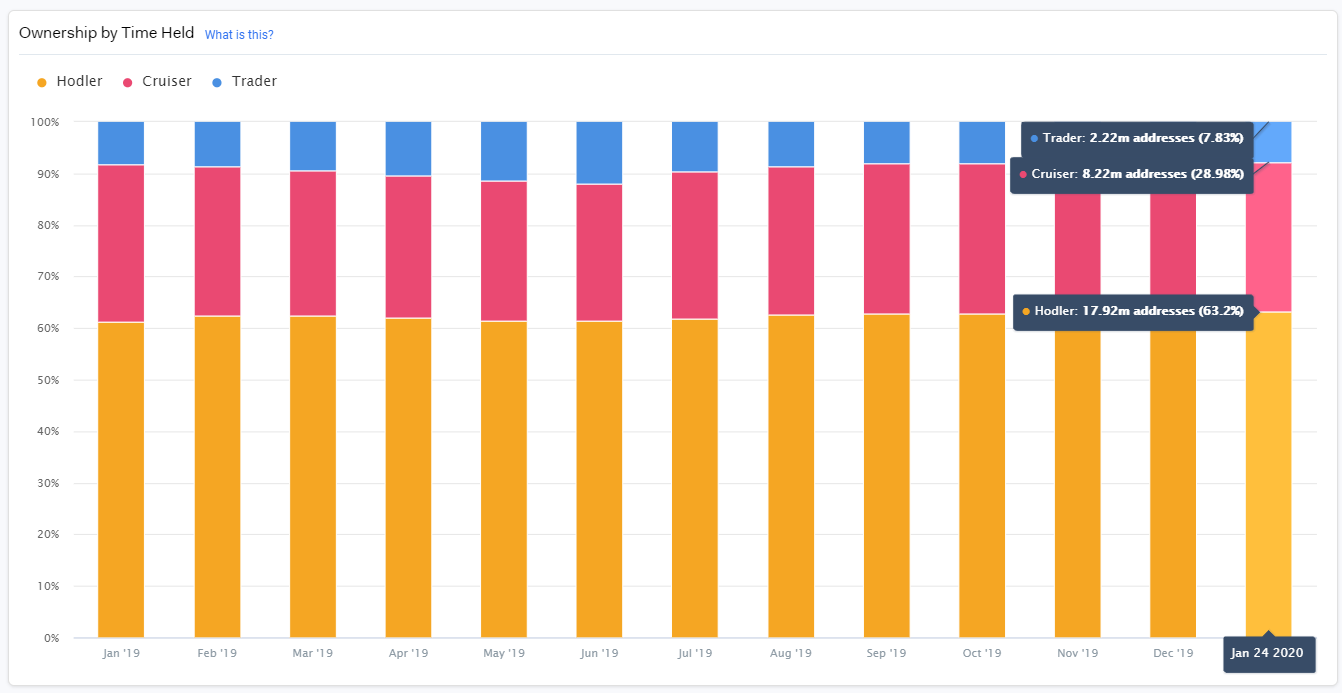
According to IntoTheBlock, over 63 percent of all Bitcoin addresses hold BTC for more than a year. Meanwhile, the remaining 37 percent hold this cryptocurrency for 1 to 365 days. The massive amount of “hodlers” in the space could indicate that investors understand the economics behind the flagship cryptocurrency and are expecting higher prices in the future.

Although Bitcoin could certainly pull back from the current price levels, several technical indicators estimate that it could have entered a new bull run, from a long-term perspective. Now, it remains to be seen whether demand for BTC will increase allowing it to break the $9,000 resistance level. Such a bullish impulse could trigger a stage of FOMO (fear-of-missing-out) among investors pushing the pioneer cryptocurrency to higher highs.
Bitcoin Market Data
At the time of press 6:13 pm UTC on Jan. 24, 2020, Bitcoin is ranked #1 by market cap and the price is up 1.46% over the past 24 hours. Bitcoin has a market capitalization of $154.16 billion with a 24-hour trading volume of $24.42 billion. Learn more about Bitcoin ›
Crypto Market Summary
At the time of press 6:13 pm UTC on Jan. 24, 2020, the total crypto market is valued at at $232.83 billion with a 24-hour volume of $94.66 billion. Bitcoin dominance is currently at 66.20%. Learn more about the crypto market ›


