‘Whale’ indicator that preceded 2020’s Bitcoin (BTC) crash is now back
A technical indicator that preceded a sudden Bitcoin drop in February 2020 is flashing the warning signs again.

Cover art/illustration via CryptoSlate. Image includes combined content which may include the use of AI tools.
Bitcoin proponents and investors are (understandably) calling for a ‘supercycle,’ with predictions of the world's largest cryptocurrency by market cap reaching as high as $1 million in certain circles.
But that party could be spoiled if one technical indicator is to be considered. “$BTC Exchange Whale Ratio(72h MA) reached 90%,” warned Ki-Young Ju, the founder of crypto analytics tools CryptoQuant, in a tweet today.
He added, “It's highest since Feb 2020 before the mass-dumping. Don't take too much leverage on your longs. Be careful.”
$BTC Exchange Whale Ratio(72h MA) reached 90%.
It's highest since Feb 2020 before the mass-dumping. Don't take too much leverage on your longs. Be careful.
Chart ? https://t.co/t3orEMC7sC pic.twitter.com/vynh5ArB9I
— Ki Young Ju 주기영 (@ki_young_ju) August 10, 2021
What’s the whale dumping tool?
As per CryptoQuant, the so-called ‘Whale Dumping’ is a measure of deposits from some of the largest holders of Bitcoin—colloquially known as ‘whales’ in financial circles.
Such holders are usually secretive about their trades and their identity is oft-unknown, but tracking what whale wallets helps provide information on what large holders of Bitcoin and other cryptocurrencies are doing and how their trades could impact the market.
Two indicators are used by CryptoQuant to check how whales dump their coins: 1. An ‘All Exchanges Inflow Mean (24h MA)’ tool that calculates the average amount of Bitcoin deposits to all crypto exchanges, and 2. an Exchange Whale Ratio tool, which calculates the top 10 inflow transactions to total inflows.
The latter indicator is said to flash a ratio above 85% when prices shoot upwards in a ‘fakeout’ or precede a dump. “In the bull market, it often keeps below 85%. On the other hand, in the bear market or fake bull for a mass-dumping, it usually keeps above 85%,” explains the CryptoQuant blog.
Where’s Bitcoin on that chart now?
As the below image shows, Bitcoin’s ‘Exchange Whale Ratio’ sits on a 0.90 level at press time, signifying conditions ripe for ‘mass dumping,' as per CryptoQuant.
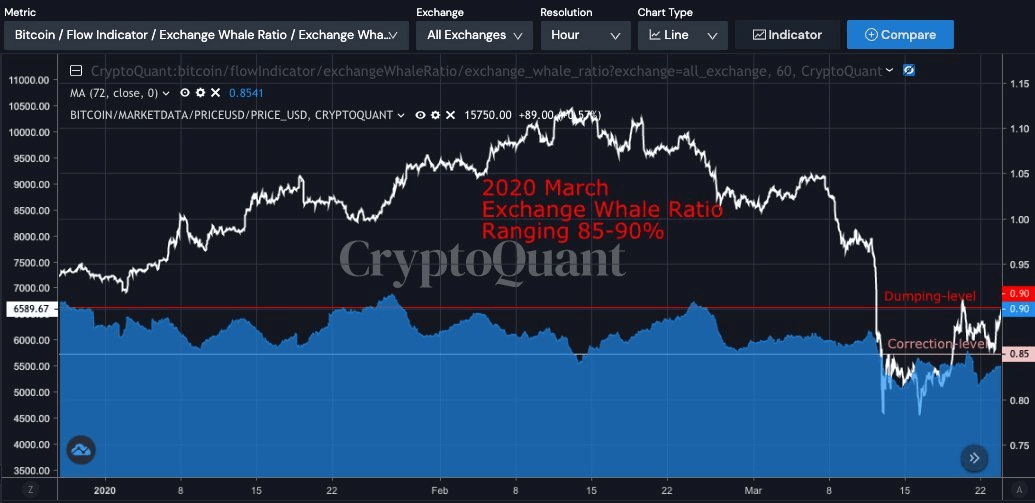
Bitcoin saw sudden drops on several instances the last time such levels were reached. In March 2020, when BTC fell to below $4,000 for several hours, the tool reached a high of 0.90. The tool stayed above 0.85 even earlier in November 2018, when Bitcoin fell from above $6,000 to under $3,900.
Bitcoin trades above $45,000 for now and is up nearly 15% in the past few days alone. But seeing the resistance there is at the $46,000 level, could the Whale Dumping tool prove correct? Only time can tell.