Research: This on-chain ratio shows Bitcoin could go lower before final capitulation
Both the SLRV Ribbons and the SLRV Ratio show that BTC could see a further decline from its $19,600 levels before final capitulation.

Cover art/illustration via CryptoSlate. Image includes combined content which may include the use of AI tools.
One of the most frequently used on-chain metrics to determine Bitcoin's performance is the behavior of its long-term holders. Defined as addresses that haven't moved any BTC in six to twelve months, long-term holders often indicate market tops and bottoms.
The short-to-long-term realized value (SLRV) ratio looks at the behavior differences between short and long-term holders to detect bear markets. The SLRV ratio shows the percentage of Bitcoin's supply that was last moved within 24 hours divided by the percentage that was last moved between six and twelve months ago.
A high SLRV ratio shows that short-term holders are more active on the network and can often indicate a hype cycle or that a market top is near. A low SLRV ratio indicates little activity from short-term holders or that the base of long-term holders has increased significantly.
The ratio was created by Capriole Investments, a cryptocurrency investment fund, to identify market transitions between risk-on and risk-off allocations to Bitcoin.
According to the SLRV Ratio, Bitcoin is currently in the pink zone, where it has been since June this year, when it put in a local bottom of $17,600. The pink zone shows an SLRV Ratio below 0.04 and has historically coincided with the accumulation zone of prior bear markets.
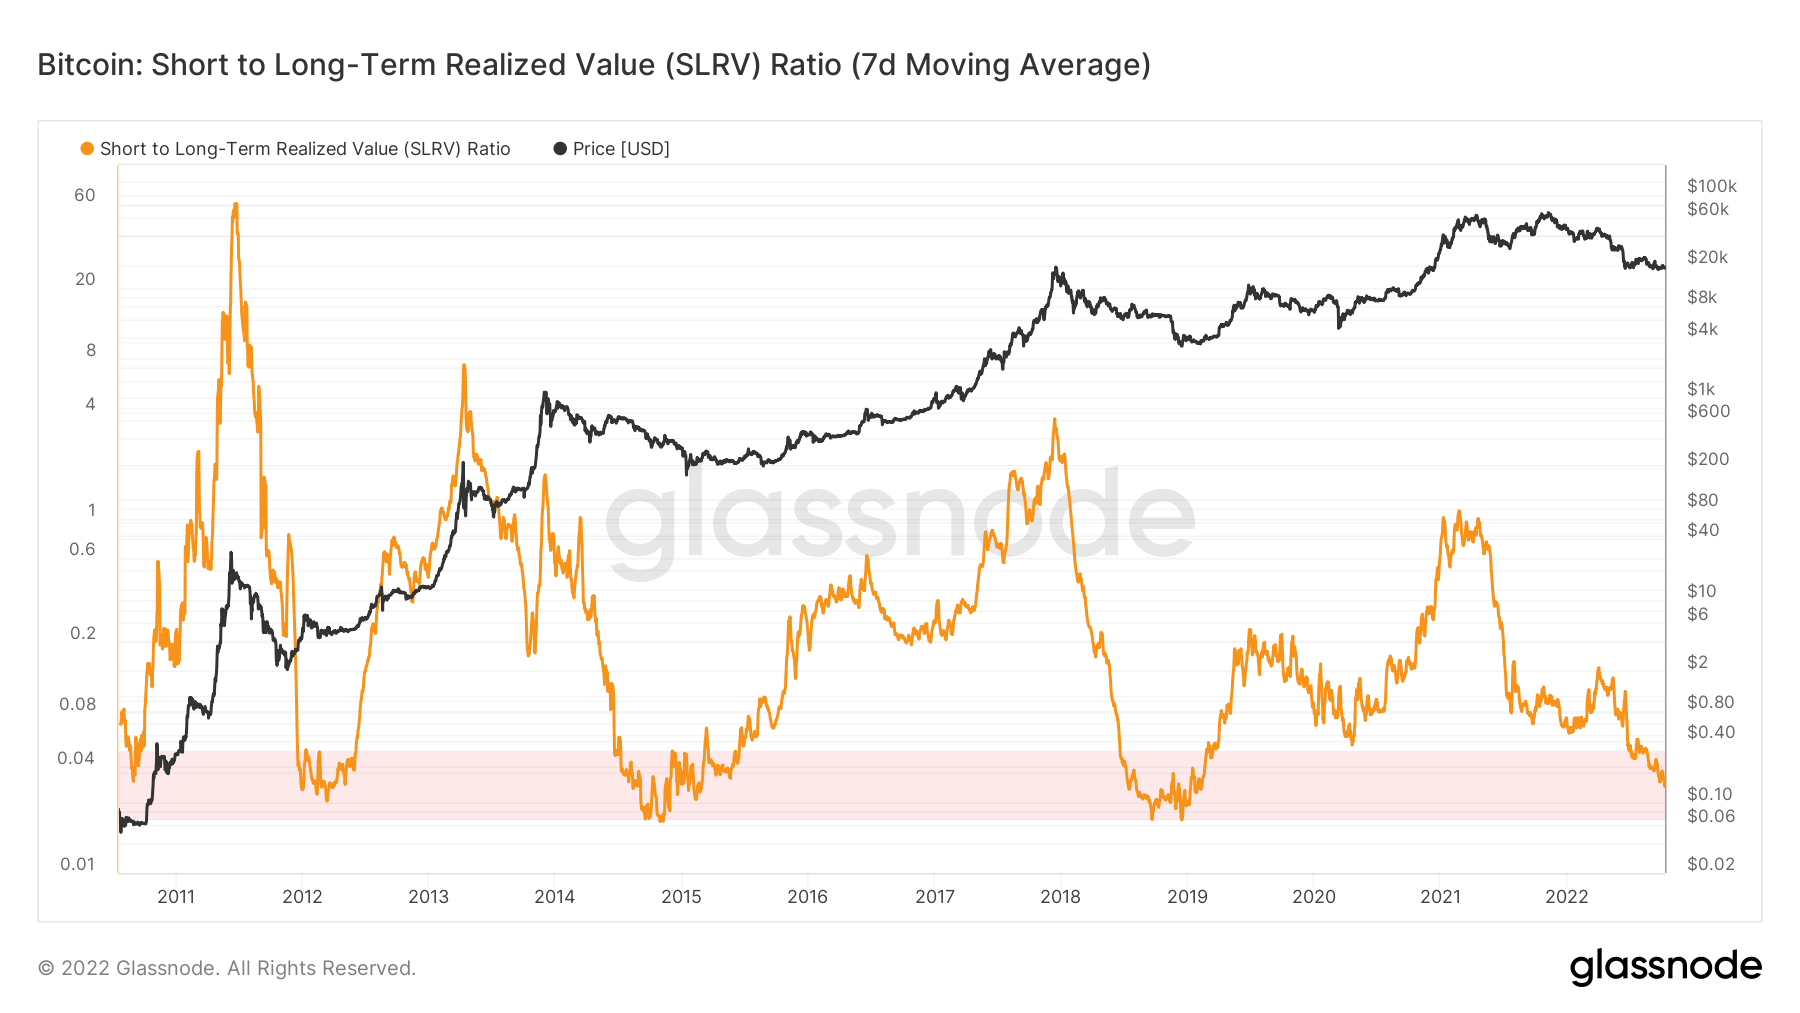
In every previous bear market, Bitcoin put in a firm bottom in the pink zone, marking the final price capitulation before a rebound. However, data from Glassnode shows that BTC still hasn't reached the bottom of the pink zone. This suggests that it could see a further decline from its $19,600 level before final capitulation.
Diving deeper into the SLRV Ratio reveals that Bitcoin put in a lower high with every bull run. This could mean that Bitcoin may see less severe bull and bear market drawdowns in the future, with less volatility in between. Aside from bringing relief to long-term investors, a less volatile market could also increase institutional adoption.
To solve some of the issues with the SLRV Ratio, Capriole Investments created SLRV Ribbons. SLRV Ribbons is an investment strategy that applies a short-term and a long-term moving average to the SLRV Ratio to mark the transition from a risk-on to a risk-off market.
SLRV Ribbons consist of a 30-day moving average and a 150-day moving average. The 30-day MA surpassing the 150-day MA suggests the market is exiting a period dominated by long-term holder activity.
Periods where long-term holders show the most activity are often associated with accumulation zones — price bottoms LTHs use to increase their BTC holdings. Short-term holder activity tends to increase at later stages of these accumulation zones, showing the beginning of a new adoption cycle and the beginning of a market rebound.
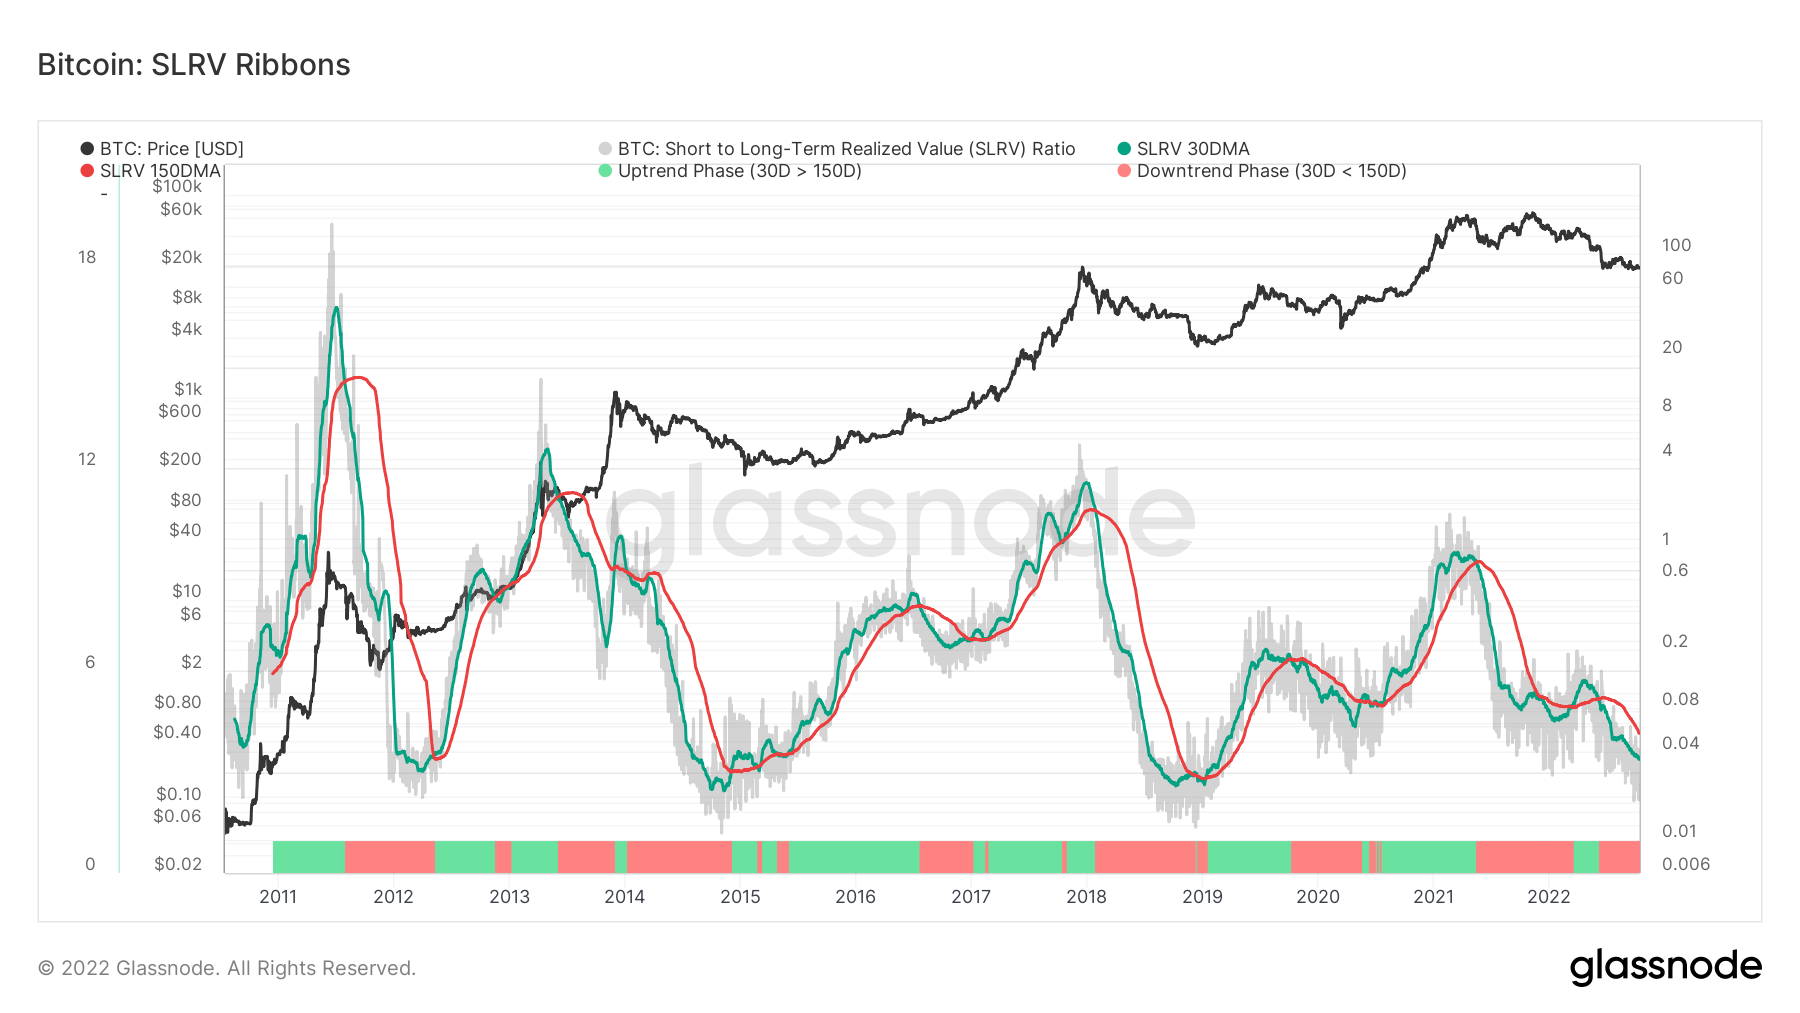
The SLRV Ribbons show that the market has been in a predominantly risk-off state since China's Bitcoin mining ban in May 2021. The downward trajectory of the SLRV 150-day MA has been briefly broken by a short-lived bear market rally at the beginning of 2022 but currently shows no signs of reversal.
A lack of trend reversal in sight further reinforces the data presented by the SLRV Ratio — Bitcoin could have further down to go before reaching the bottom.