Research: On-chain metrics suggest more pain ahead for long-term Bitcoin holders
The Total Bitcoin Supply in Loss suggests the market bottom is not yet in, however, long-term holders remain optimistic.

Cover art/illustration via CryptoSlate. Image includes combined content which may include the use of AI tools.
It has been nine months since the market top and in that time, about $2 trillion in capital has left the space hitting token prices hard.
However, the question of whether the market bottom is in yet remains.
An analysis by CryptoSlate of on-chain data from Glassnode reveals generally positive sentiment from long-term holders. However, a comparison of total supply in loss to previous years indicates the bottom is not yet in.
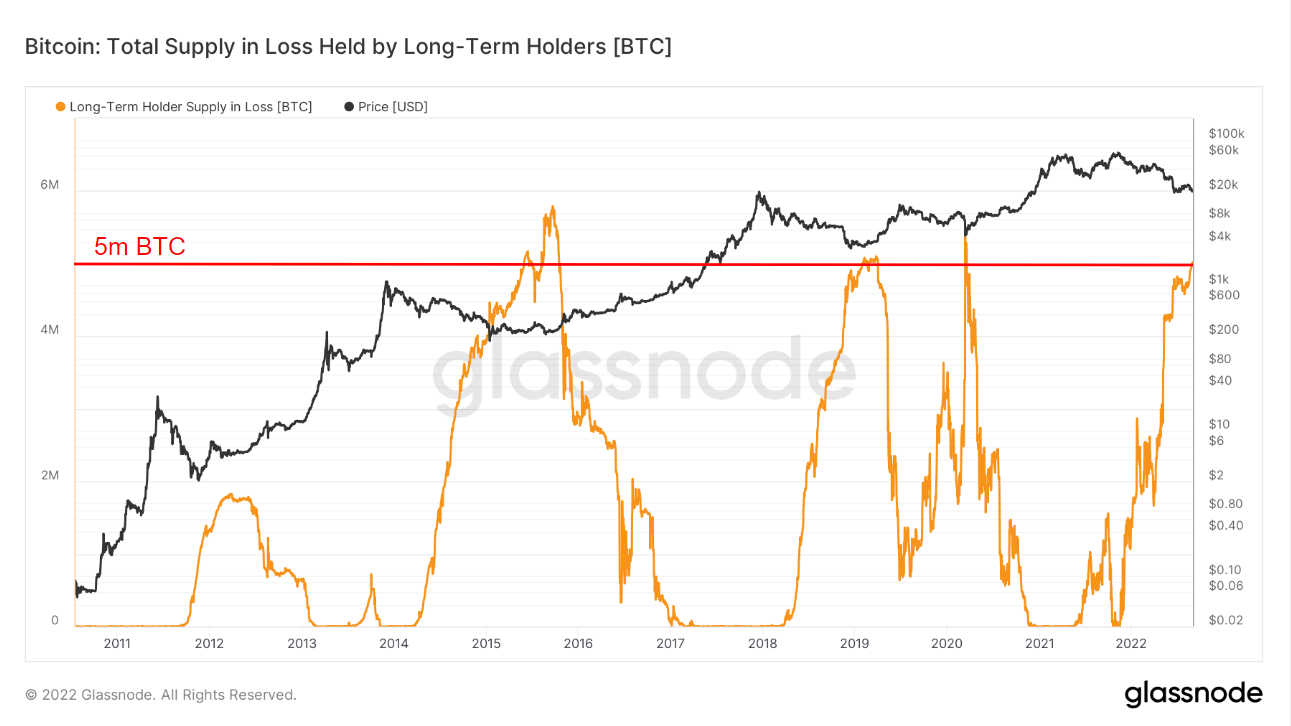
Total Bitcoin Supply in Loss
Long-term Bitcoin holders are defined as those who have held BTC for more than 155 days. Based on past data, the capitulation of long-term Bitcoin holders usually accompanies market cycle bottoms.
The chart below shows the total supply of long-term holders (LTH) in loss for the past 11 years. In 2015, 2019, and 2020, when this metric exceeded 5 million tokens in loss, the BTC price soon reverted to an uptrend.
The current supply in loss is approaching this threshold. However, it has yet to cross beyond it, suggesting the market has yet to bottom and further pain lies ahead for Bitcoin holders.
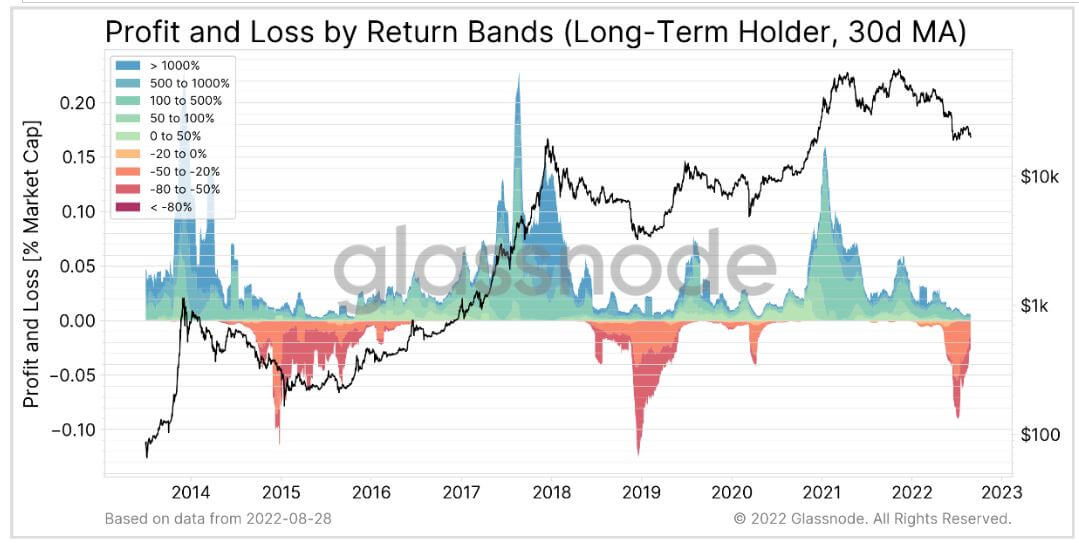
Profit and Loss by Return Bands
The Profit and Loss by Return Band metric illustrates the pain currently being felt by LTHs. This metric shows the spending behavior of various market cohorts segmented into bands related to the magnitude of realized profit/loss.
The data is presented as a percentage of the market cap. For example, a Y value of +0.5 indicates the total profit realized was equal to 0.5% multiplied by the total market cap at that point in time (X coordinate).
Meanwhile, profit or loss is calculated in USD by taking the coin value and multiplying it by the price sold minus the price when bought. This calculation is then aggregated for all spent coins and apportioned to the relevant return band.
The chart below shows LTHs deep within the capitulation zone. However, the current lower band is reading approximately -0.07, which is significantly less than 2015's lowest band of -0.12, and 2019's lowest reading of -0.14.
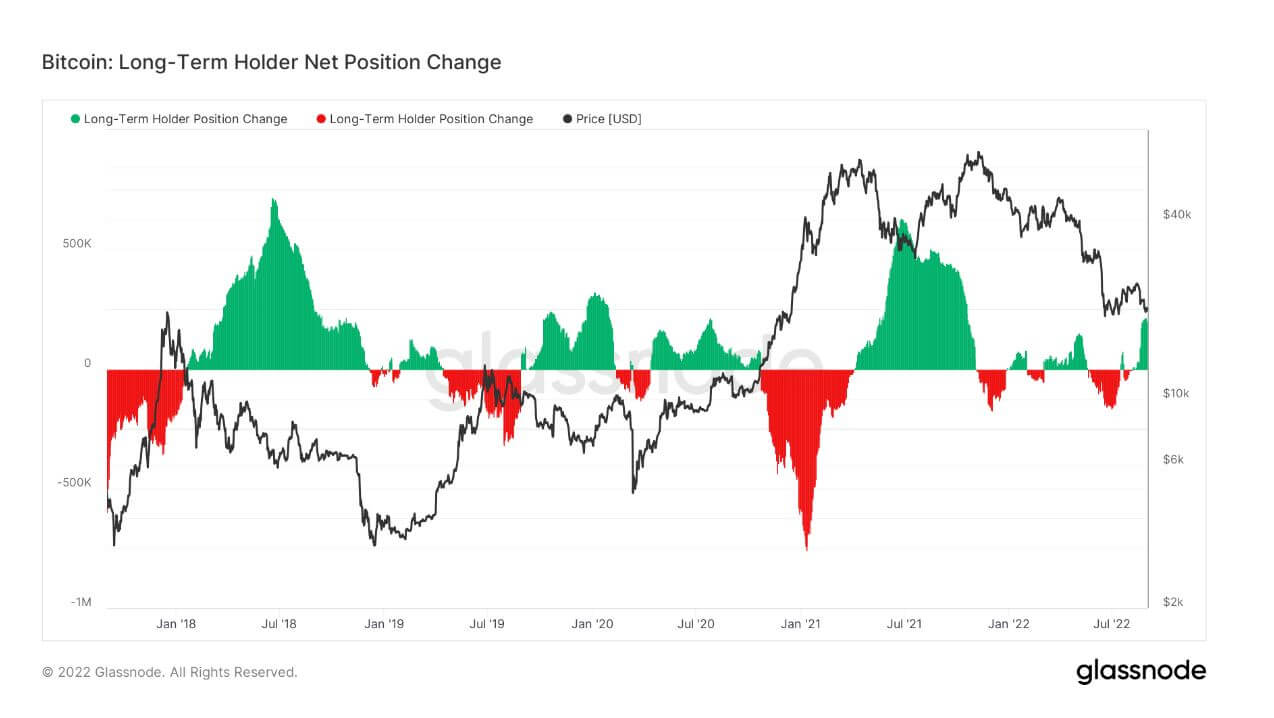
Long-Term Holder Net Position Change
LTH Net Position Change refers to either the distribution of tokens as LTHs cash out or accumulation as holders take on new positions.
The chart below shows 2022's Net Position Change flipping between distribution and accumulation, and at lower magnitudes compared to previous years. This suggests high uncertainty amid deteriorating macro conditions.
Since August, LTHs have been accumulating at their highest levels this year. This is an encouraging sign in terms of long-term sentiment toward Bitcoin.