On-chain data shows Bitcoin whales are actively selling, is trouble brewing?
Whale momentum is thinning suggesting the Bitcoin price will continue to range, if not fall lower.

Cover art/illustration via CryptoSlate. Image includes combined content which may include the use of AI tools.
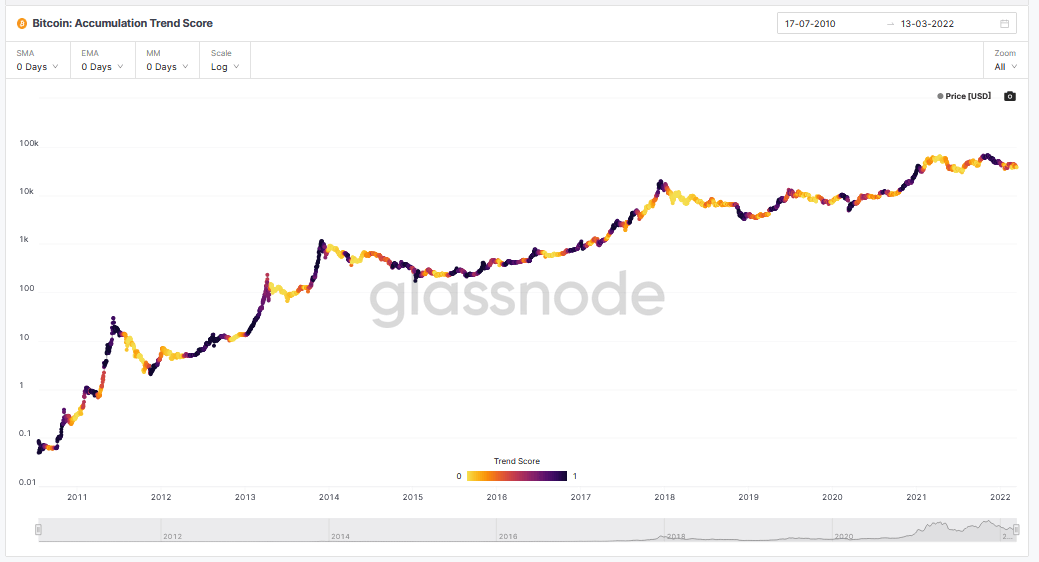
A new metric from on-chain data analysts Glassnode looks at the relative size of entities actively accumulating or distributing coins in terms of their Bitcoin holdings. In short, the “Accumulation Trend Score” measures whale activity.
The current Accumulation Trend Score shows whales are activity distributing tokens, suggesting a low probability of reversing the recent price slump, should this pattern persist.
Since November, Bitcoin has been trending downwards, having peaked at $69,000. Early February saw a break of the downtrend, but $BTC has been moving sideways ever since, posting a low of $34,300 during this period.
This limbo state has divided opinion on whether we are in a bear market or not. However, against a backdrop of economic uncertainty, sentiment is skewed to the former.
Today's price action sees a 3% gain accompanied by an upturn in the Relative Strength Index (RSI), to 46% at the time of writing. Although this shifts momentum towards the overbought territory, it remains to be seen if bulls can break the momentum downtrend.
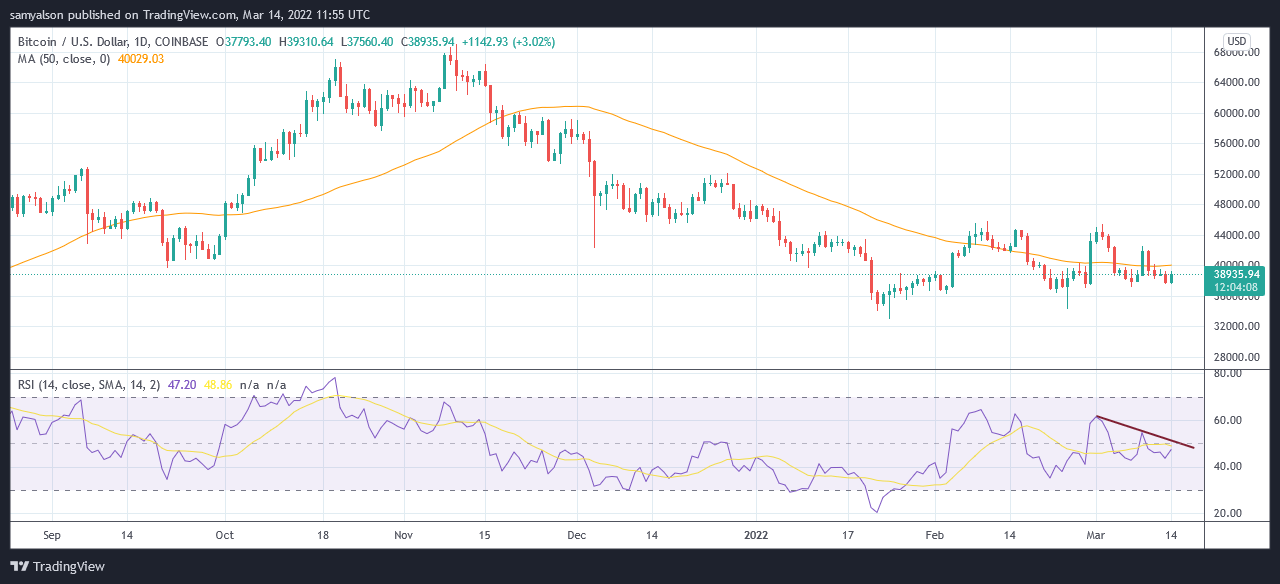
According to the data, with whales in a distribution phase, signs point to further ranging if not a price drop from here.
What is the Accumulation Trend Score?
The Accumulation Trend Score represents the size of the entities' balance (their participation score) and the number of new coins acquired/sold over the last month (their balance change score).
The score falls along a scale of 0 to 1. A score closer to 0 means larger entities are on balance distributing, not accumulating, while a score closer to 1 shows larger entities are accumulating, not distributing.
However, a score of 1 doesn't necessarily correlate with surging price or vice versa. For example, mid-April 2021 saw the price of $BTC peak at $65,000 (the highest price in 2021). But the Accumulation Trend Score was hovering at the low end, with April 4, 2021, showing a score of 0.
The start of 2022 opened with a score of around 0.7, indicating whales mainly were accumulating. The current score is 0.027, showing a complete turnaround in sentiment.
Small fish are snapping up Bitcoin
Data from on-chain analysts Ecoinometrics supports the view that whales are selling. However, their analysis also included examining what “small fish” are doing, and contrary to the whales, retail investors are currently buying Bitcoin.
They conclude that the likelihood of a move higher is low given that the whales are out of the picture.
“#Bitcoin whales and small fish… two different worlds right now. The small fish are accumulating like there is no tomorrow while the whales are distributing. Without the whales, I doubt there is enough momentum for a sustained trend upward.”
The FOMC meeting will take place either this coming Tuesday or Wednesday. Analysts expect U.S interest rates will rise by 0.25%-0.5%. While some say this will have little impact on surging inflation, the Fed must also consider the effect of raising rates too high.
All eyes are on what the Fed will do next.