Navigating Bitcoin’s cyclical patterns
An exploration of bitcoin's price resistance points: the pivotal role of the $30,000 mark in the current market consolidation
Quick Take
Historically Bitcoin follows a cyclical pattern of bull and bear phases interspersed with periods of stagnation. Currently, we are in a stagnation period where the price is trending sideways. This period often has investors on edge, as they are unsure whether the price could surge or plummet.
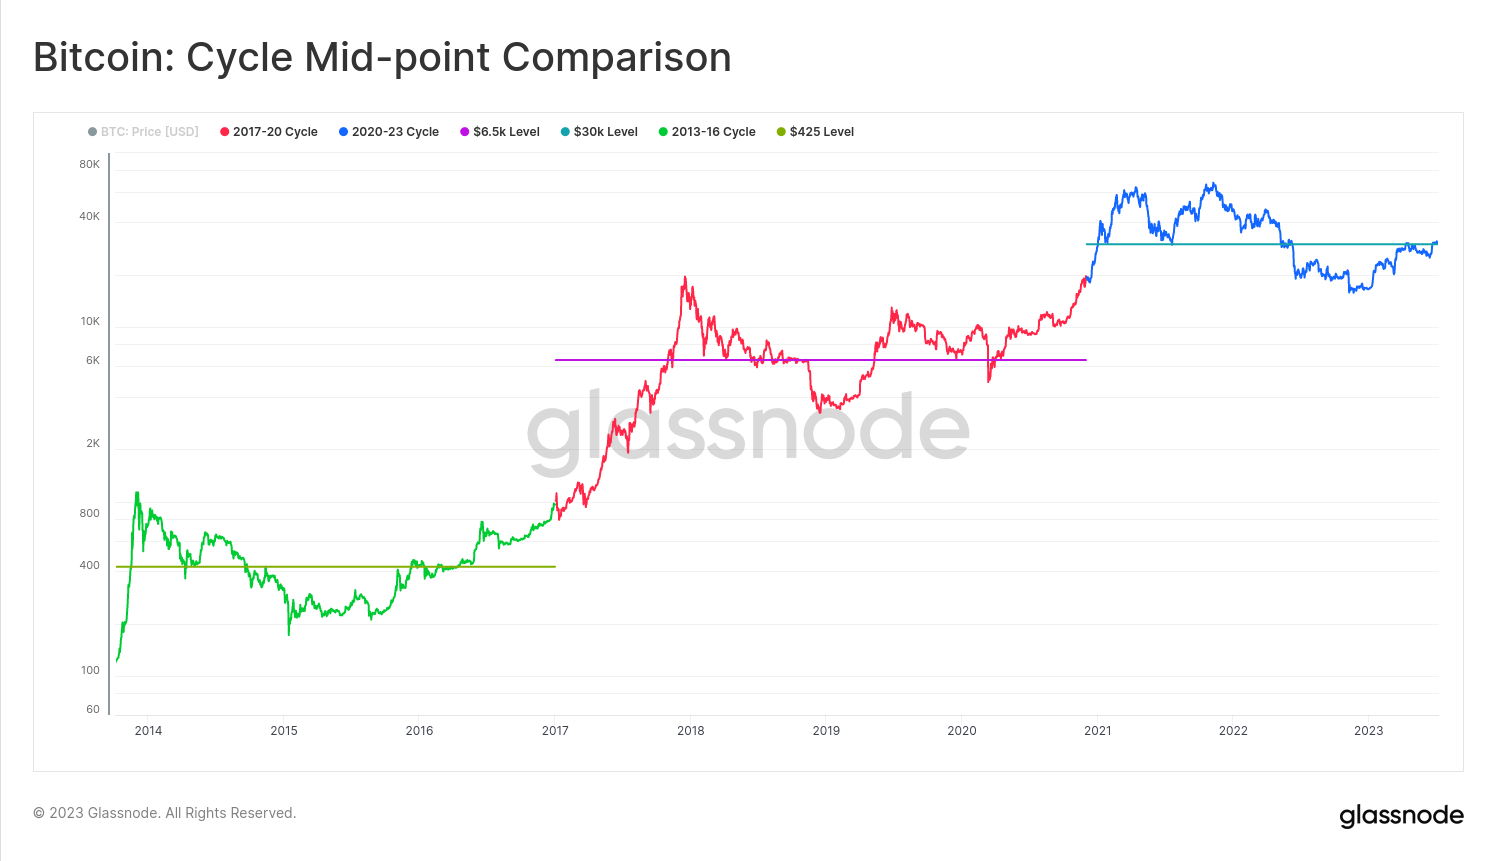
Glassnode's analyst, James Check, draws our attention to the fact that in previous cycles, Bitcoin's price was often stuck at resistance points. For instance, during the 2021-2022 cycle, the midpoint was pegged at around $30,000.
From 2013 to 2016, the resistance point hovered around $425. Similarly, in the 2018-2019 cycle, it was approximately $6,500.
Presently, the market appears to be again consolidating around the $30,000 mark. This sets up an intriguing situation for Bitcoin, as we wait to see whether it will break through this resistance or succumb to it.