How Grayscale GBTC sell-off has impacted Bitcoin long-term holder metrics
Glassnode analysis reveals shifts in Bitcoin holding trends with impact of Grayscale sell-off assessed.
Quick Take
The sell-off from Grayscale has had an interesting effect on well-known Bitcoin metrics, skewing data heading into the next halving. Examining the duration since bitcoins were last transacted on-chain, we can categorize them according to their “Supply Last Active” (SLA) period, spanning from 1+ years to 5+ years. This metric has historically been a valuable metric in determining market cycles. However, because Grayscale outflows are coming from wallets that have not been active in a long time, current data looks very different from the past.
Glassnode's chart illustrates the overlay of various SLA variants as a percentage of the circulating supply. As coins remain in the possession of long-term investors, these metrics typically ascend. Conversely, when long-term investors divest their coins, the metrics decline as older coins transition to new holders.
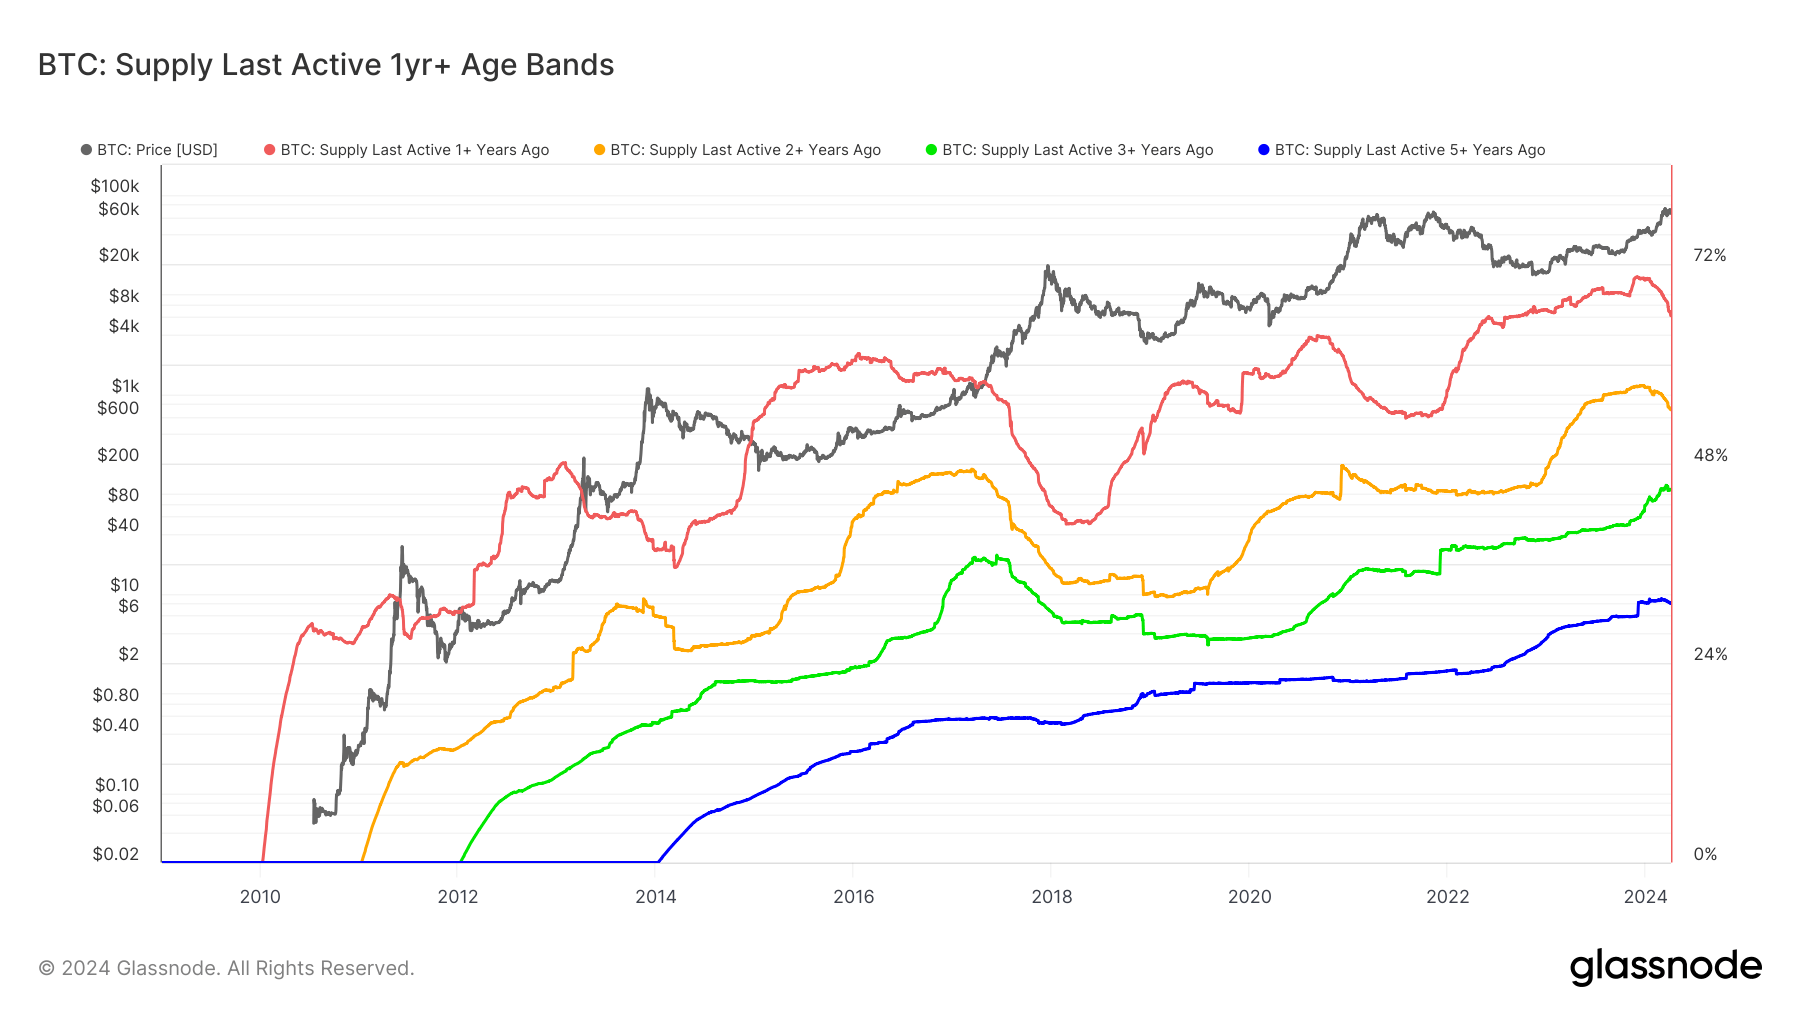
Historically, long-term holders (LTH), those holding for over 155 days, tend to distribute their coins during bull market peaks, capitalizing on profits accumulated during bearish periods. As Bitcoin reached its all-time high recently, all SLA cohorts have decreased from their previous record levels.
However, it's essential to consider the impact of the Grayscale Bitcoin Trust (GBTC) selling roughly 300,000 BTC. Investors who acquired GBTC, particularly during periods of discount in recent years, are classified as long-term holders. Consequently, the data may be skewed due to GBTC outflows.
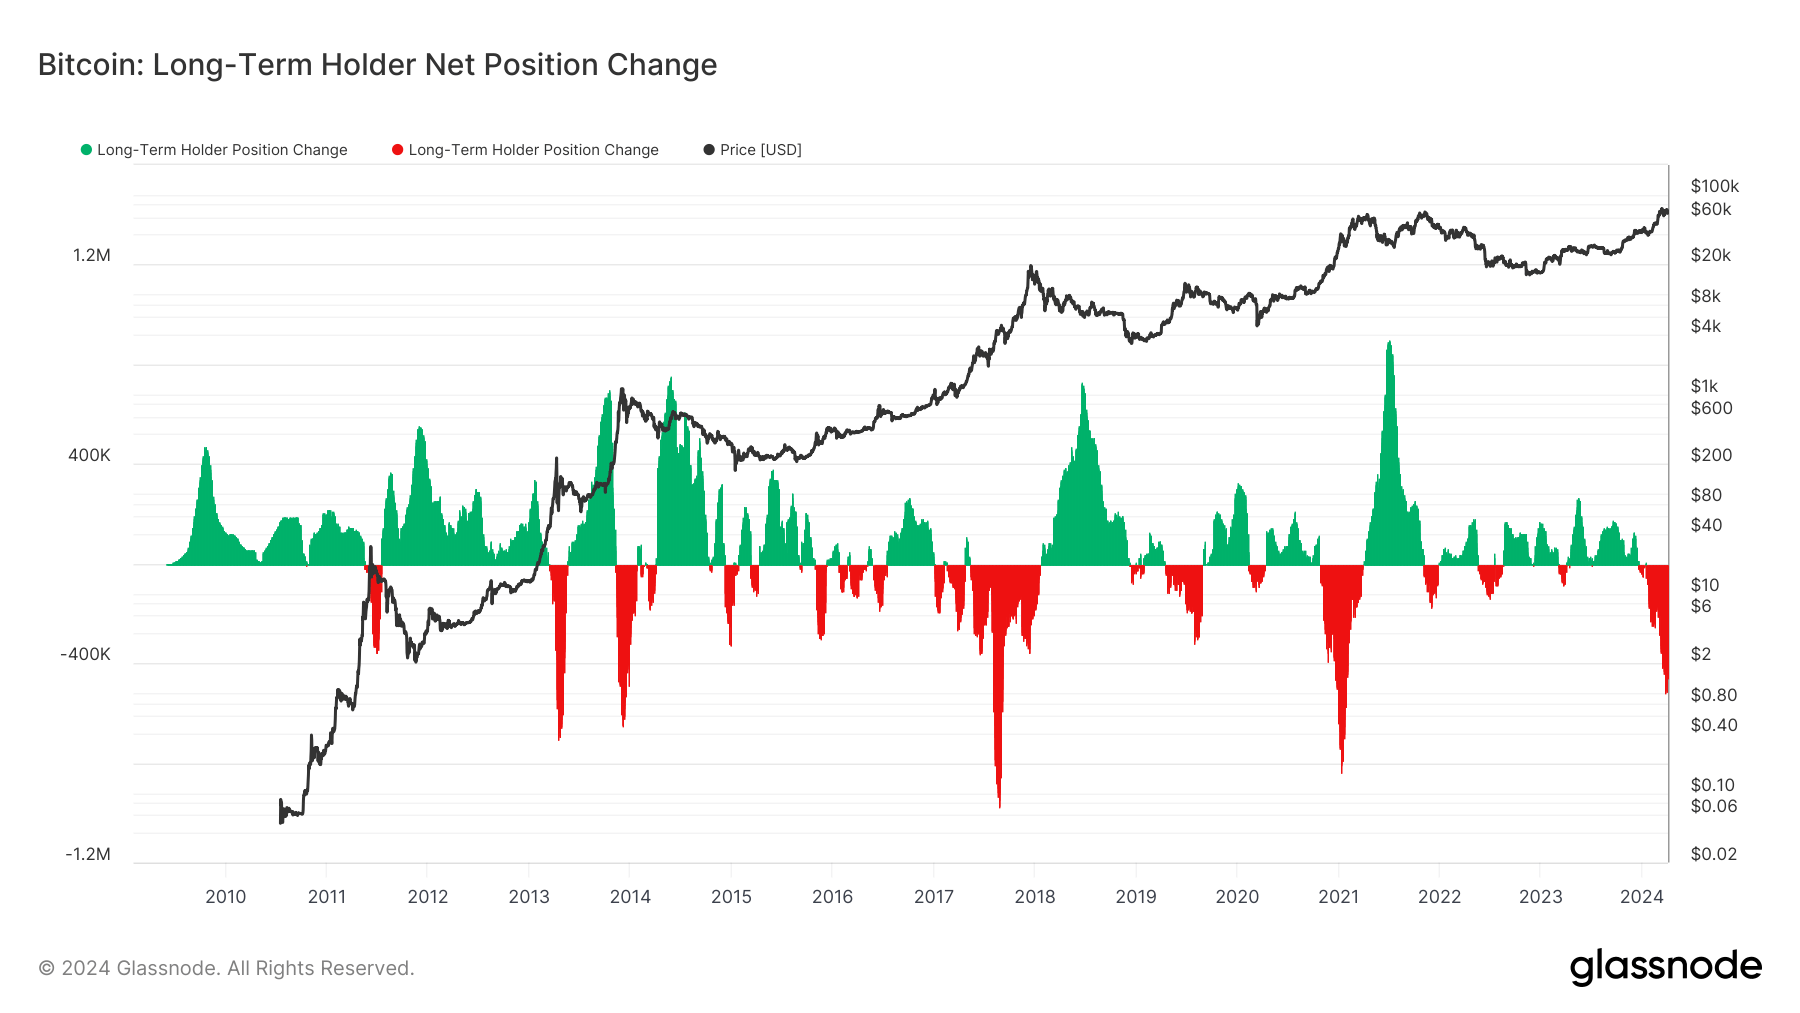
Analyzing the LTH net position change, the current sell-off mirrors a similar intensity seen during the 2013, 2017, and 2021 peaks. Despite this, the market sentiment doesn't suggest a peak, especially with a halving event looming in roughly 15 days.