 Despite 120% YTD growth, Bitcoin’s path may follow historical market corrections
 Quick Take
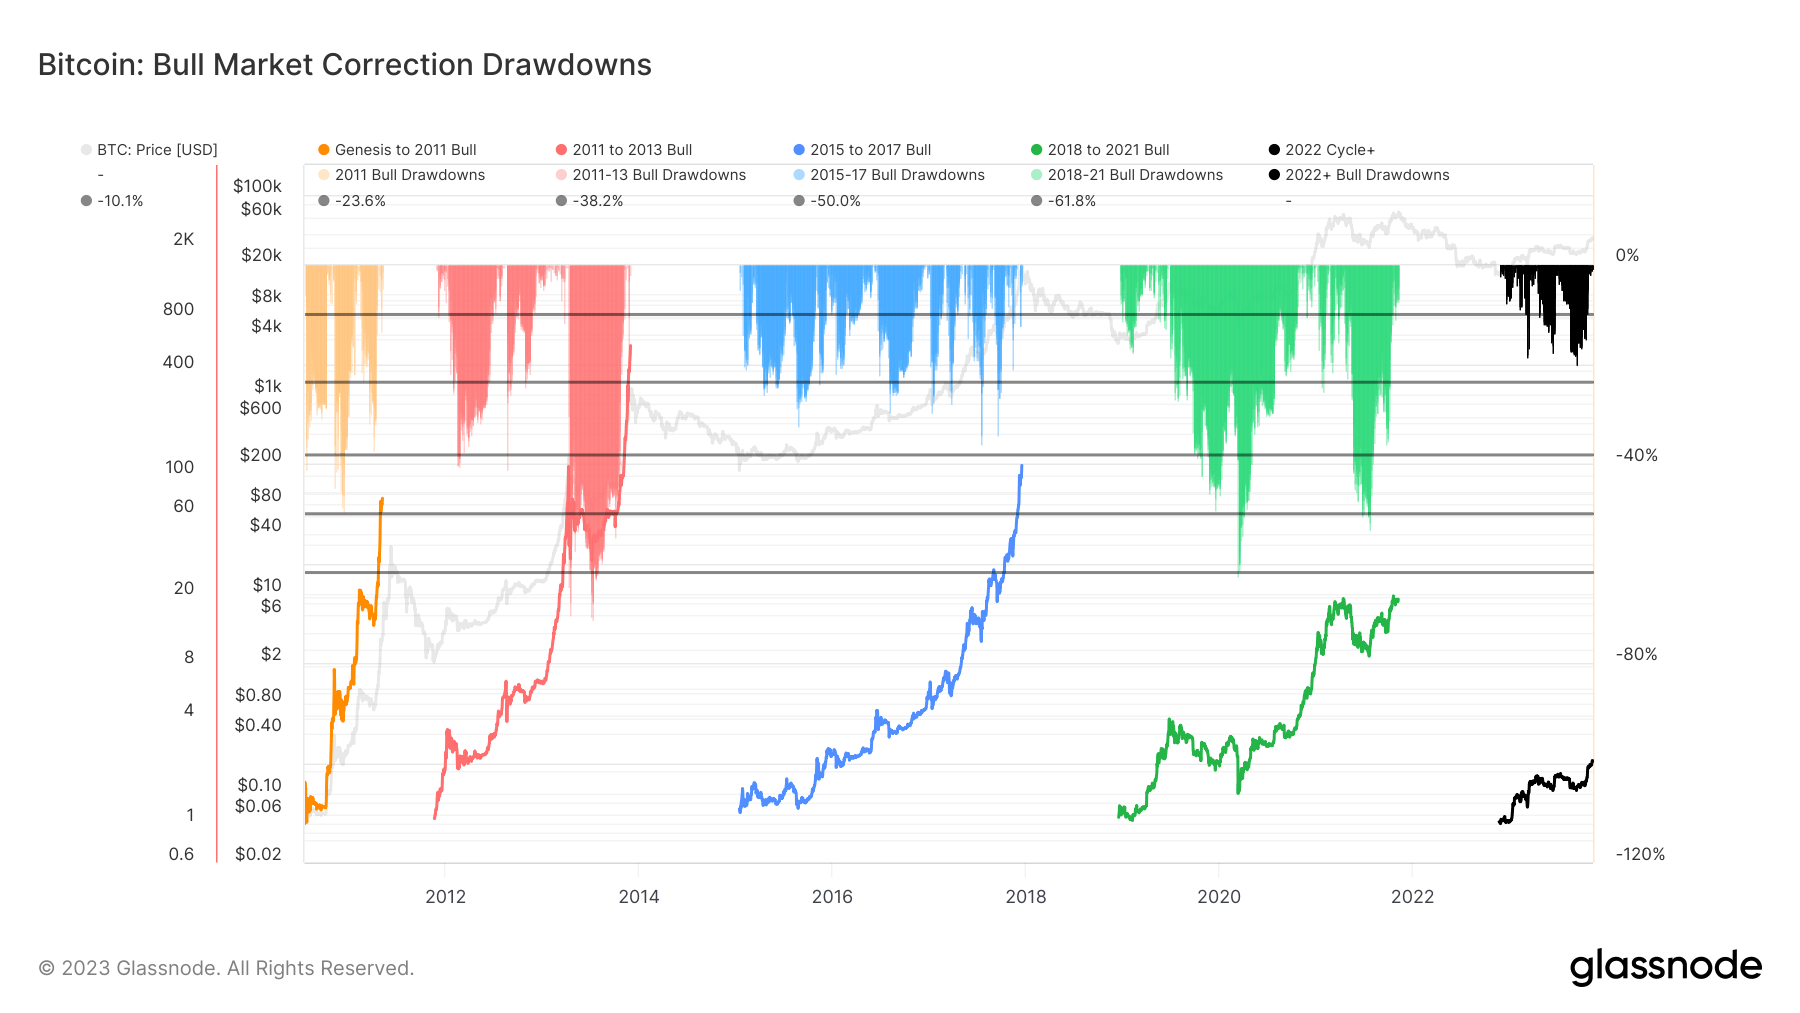
As of 2023, Bitcoin has demonstrated a robust rise of over 120% YTD, potentially signaling the onset of a new bull run. However, in keeping with historical precedents, this incline should not be expected to continue unabated without any market corrections. It is important to note that market corrections are a normal part of any financial cycle, contributing to the overall health of the market.
In 2023 alone, the most significant correction was a 20% decline in July, when Bitcoin’s value retreated from $31,000 to $25,000. Delving into historical data, during the China mining ban in 2021, a sharper correction of 50% was witnessed, though this was from an all-time high in early 2021. The 2020 Covid-induced market turmoil is viewed as an outlier due to its ‘black swan’ nature.
Historical trends from 2015-17 and 2011-13 cycles further show multiple corrections of over 30%. These corrections are often linked to factors like profit-taking, as seen in recent weeks, and the liquidation of leveraged positions, which can trigger cascading effects in the market.


