Convergence in drawdowns of Bitcoin and U.S. long bonds, as TLT plunges
Analyst observes convergence in drawdowns of Bitcoin and U.S. long bond TLT
Quick Take
Last week, Oct. 18, analyst Dylan Leclair observed a similarity in the drawdowns of Bitcoin and TLT.
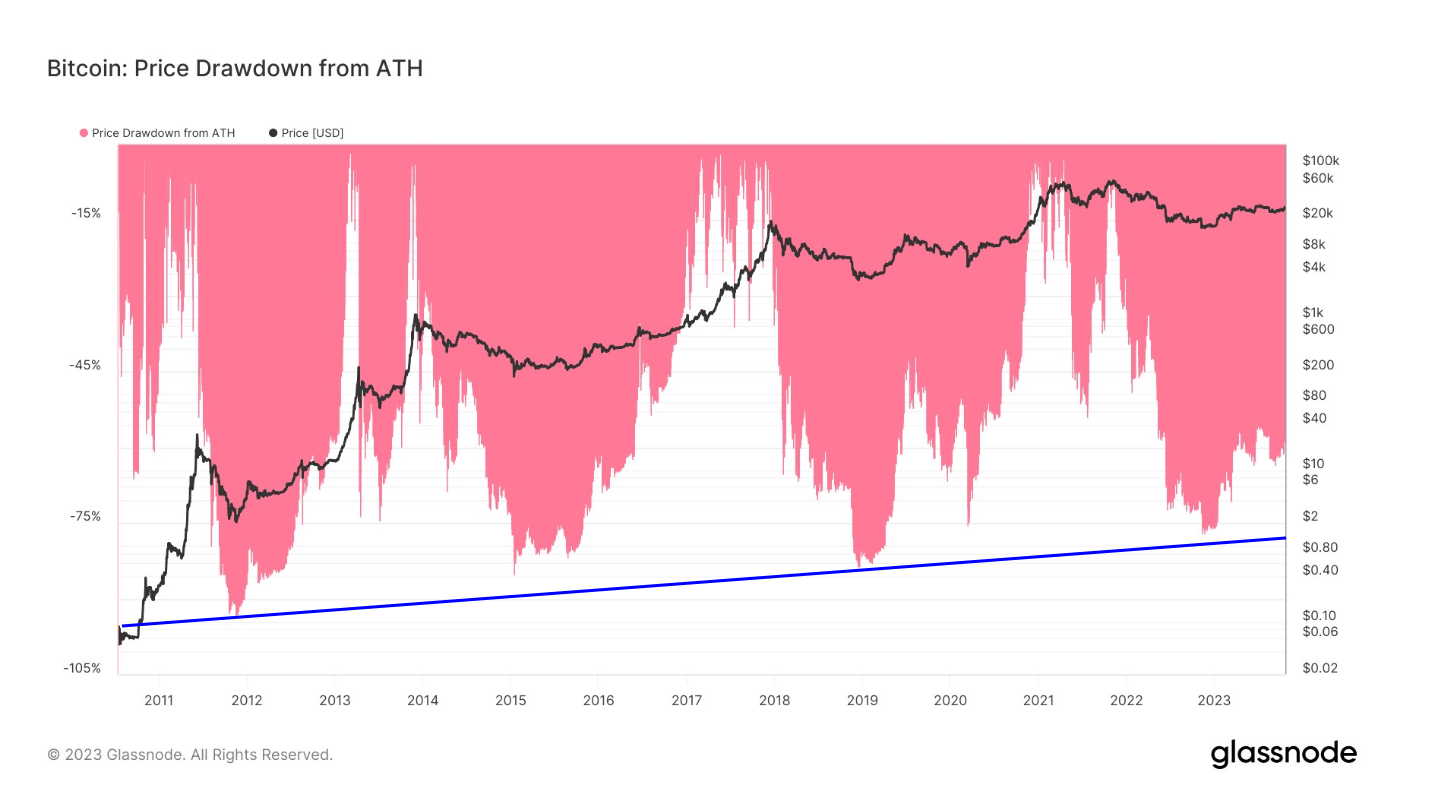
A comparison of the drawdowns of Bitcoin and TLT, the U.S. long bond, an ETF with a total asset holding of $95 billion, according to VettaFi, reveals a fascinating trend. Bitcoin, often under the scanner for its volatility, demonstrates resilience in its recovery trajectory. Following a plunge to $15,500 during the FTX collapse in Nov. 2022, Bitcoin has made a significant rebound, trading at roughly $30,000. This performance represents a drawdown of 56% from its all-time high, aligning with previous bear market behavior.
Interestingly, each successive cycle records a less severe drawdown. The maximum drawdown of this cycle for Bitcoin to date stands at 77%.
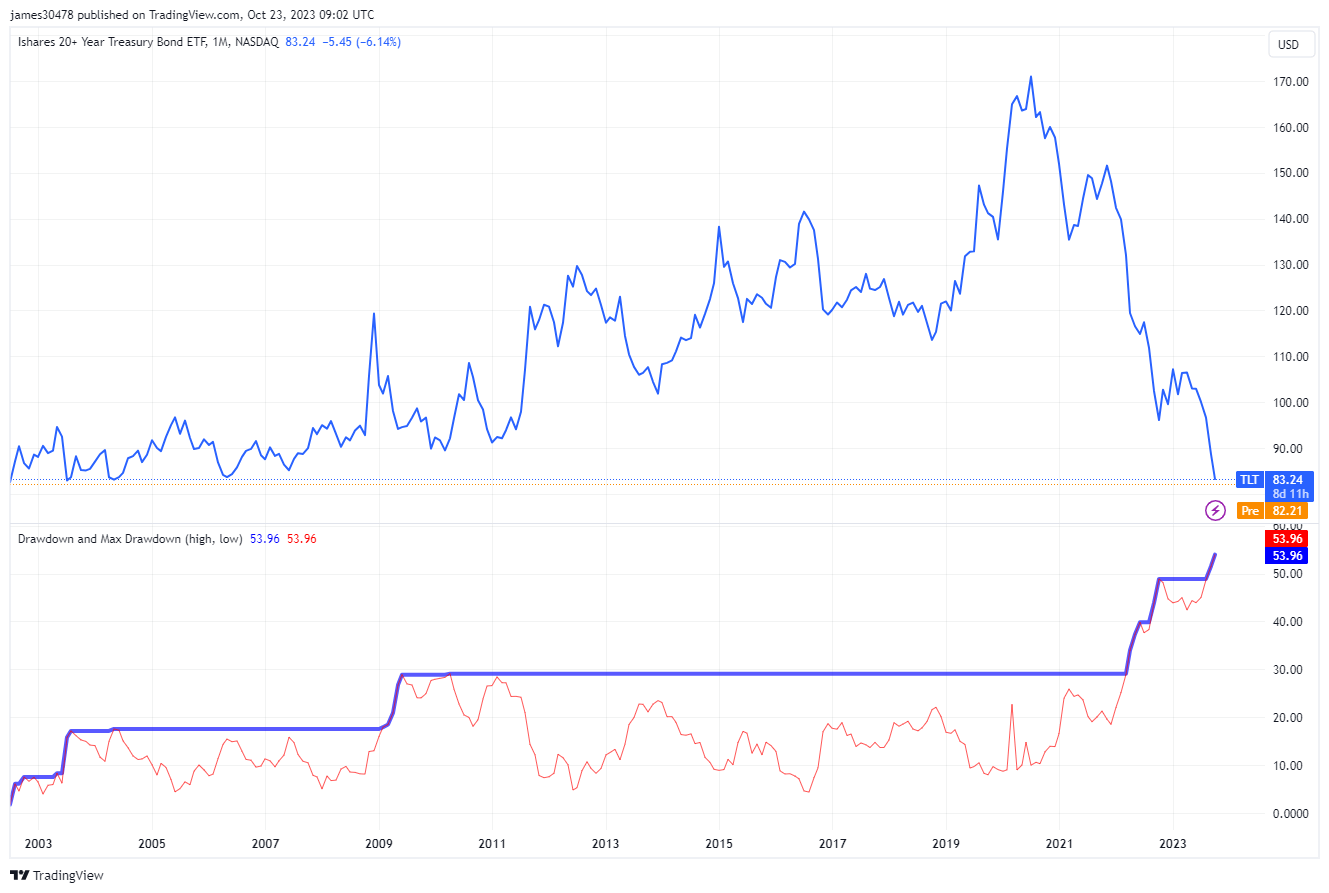
In contrast, TLT is currently witnessing its most severe drawdown ever, at 54%. This juxtaposition underscores the harsh impact felt in the bond market while simultaneously highlighting Bitcoin's recovery. A mere few percentage points now separate the two drawdowns, adding a new dimension to the discussion on financial asset stability.