Key Bitcoin indicators highlight bullish trend, reminiscent of past bull runs
Strategic moving averages indicate a positive shift in Bitcoin's financial landscape.
Quick Take
Bitcoin's financial trajectory is demonstrating positive momentum, as substantiated by key moving averages like the Pi Cycle Indicator (111D-SMA), the Mayer Multiple (200D-SMA), and the Yearly Moving Average (365D-SMA), all of which are showing a bullish trend.
In late 2022, these averages fell beneath the 200 Week Moving Average (200W-SMA), but recent analysis indicates an upward shift. The 111D-SMA ($30,825) and 200D-SMA ($29,894) are now registering values substantially higher than the 200W-SMA ($29,153). Although the 365D-SMA ($27,067) is still slightly lagging, its current trajectory indicates that it has the potential to surpass the 200W-SMA within the next week.
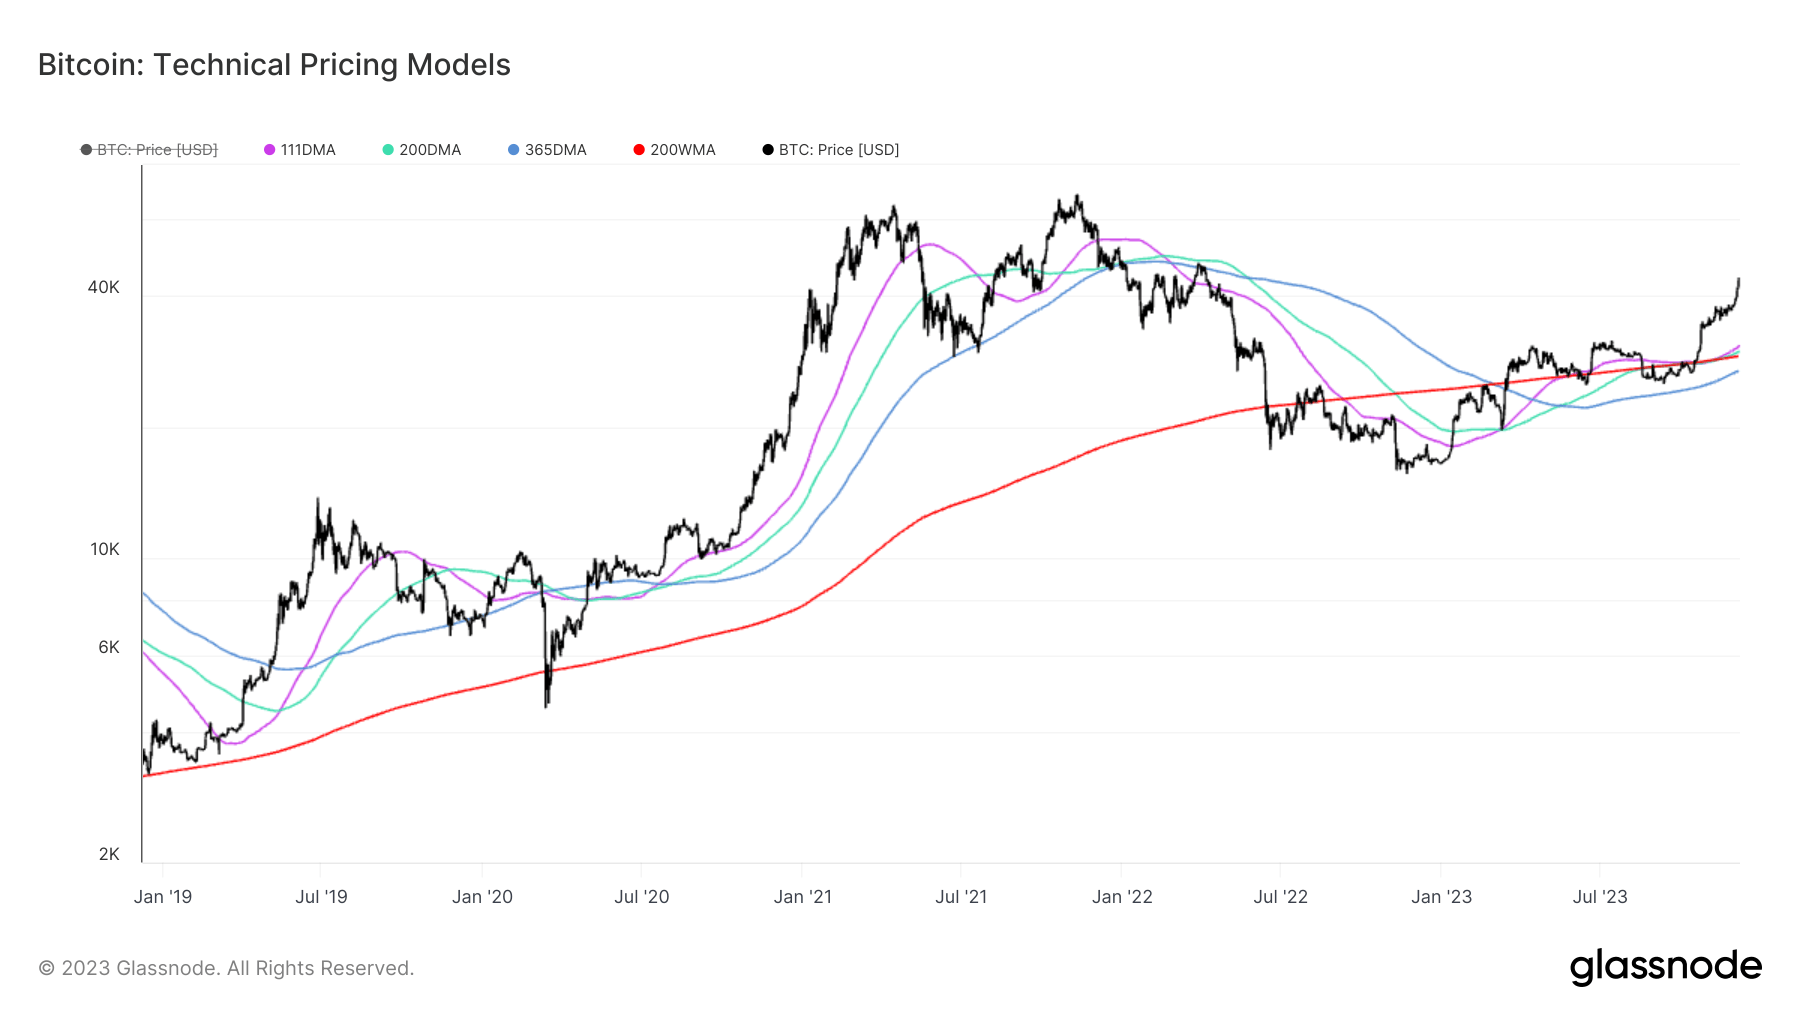
This behavior mirrors the trend observed during the previous Bitcoin bull runs in 2013 and 2017 when these moving averages collectively exhibited an upward trend.
These indicators provide reliable insight into Bitcoin's market momentum, from short-mid term (111D-SMA) to transition points between Bull and Bear markets (200D-SMA) and even high time-frame market momentum (365D-SMA).
Such analysis is not intended to be indicative of future price action. Instead, it allows a historical review of past trends to establish the current health of trading activity.