The S&P 500 just broke a critical resistance; here’s what this could mean for Bitcoin

Photo by Patrick Weissenberger on Unsplash
Despite the global economy being virtually frozen, the S&P 500 and all other benchmark stock indices have been able to rally today, smashing through critical technical levels and potentially creating shockwaves that boost Bitcoin.
This rally has allowed the S&P 500 to surmount two key moving averages that were previously suppressing its price action, leading some analysts to believe that it will see further upside in the mid-term.
Because Bitcoin’s striking correlation to this index has persisted in recent times, this could be a positive factor that works in BTC’s favor.
Stock market rallies higher as S&P 500 breaks 200-day moving average
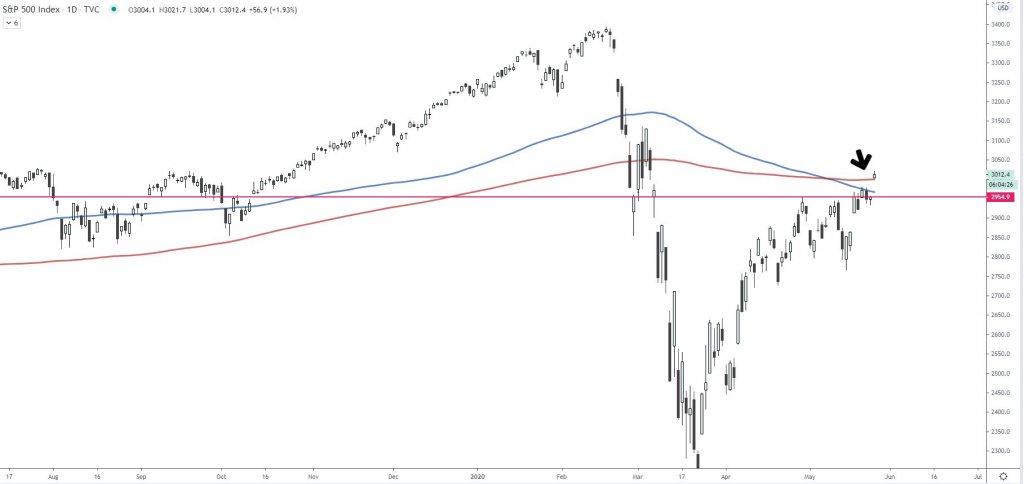
At the time of writing, the S&P 500 is trading up just under 2 percent at its current price of 3,010. This is the highest price level that the stock index has traded at since early March.
It also marks a massive rebound from its yearly lows of 2,230 that were set at the bottom of the market-wide decline in late-March.
Its massive climb from these lows has allowed it to rapidly approach its year-to-date highs of 3,380.
This recovery has come about despite there being little fundamental change to the global economy, as most countries still remain on lockdown as there has been little meaningful progress towards a vaccine to curb the ongoing pandemic.
Today’s upswing has allowed the S&P 500 to surmount its 100-day and 200-day moving averages, which had both previously been strong resistance levels.
Josh Rager – a respected analyst – spoke about this breakout, saying:
“Stock market bears in disbelief! As SPX opens up above both the 100DMA and 200DMA.”
Here’s what this could mean for Bitcoin
Many investors have been noting that Bitcoin’s swift rebound from its mid-March lows of $3,800 has confirmed its status as a “safe haven” asset.
Despite this, it is important to note that this recovery has come about in tandem with that seen by the S&P 500 and the aggregated equities market.
The below chart from the analytics platform Skew shows that the two assets have continued seeing a striking correlation – with Bitcoin’s recovery simply being more magnified than that of the stock market.
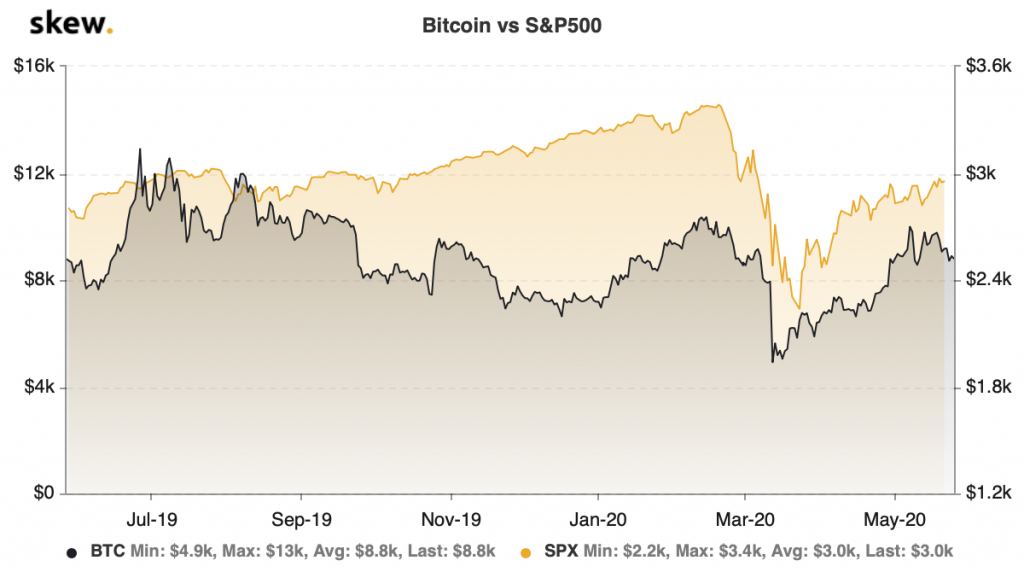
Skew data also shows that the two assets’ realized correlation has grown heightened over the past week.
If the S&P 500’s break above its 200-day moving average sparks a short-term uptrend, this could bolster where Bitcoin heads next.