Data shows that most Ethereum holders are underwater

Cover art/illustration via CryptoSlate. Image includes combined content which may include the use of AI tools.
IntoTheBlock stated that a substantial number of Ethereum holders are in losses at the moment, but multiple technical indexes estimate that they could soon move into profits as Ether prepares for an upswing.
Ethereum holders are “out of the money”
IntoTheBlock, a machine learning and statistics modeling firm, recently analyzed the addresses profitability in Ethereum using its “In/Out of the Money” indicator.
Based on this on-chain metric, the company was able to determine that out of all the addresses that are currently holding Ether only 3.28 percent of them would profit if they sold at the current market value.
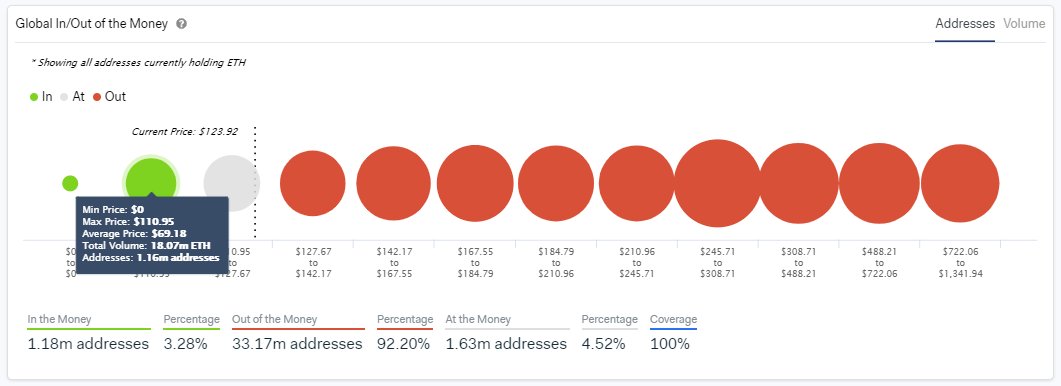
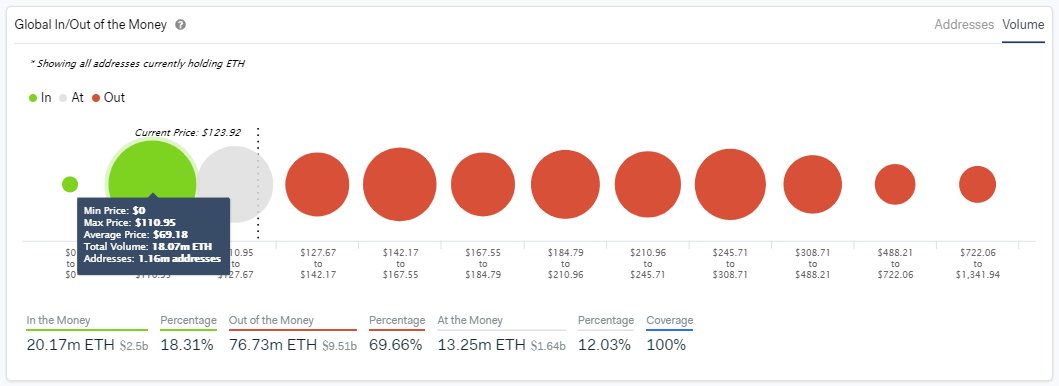
This sum represents less than 1.20 million addresses, which are currently holding over 20 million ETH that were acquired at a very low price. Currently, only 18.3 percent of the total circulating supply is “in the money,” according to IntoTheBlock.
The machine learning firm maintains that based on historical data the current percentage of addresses “in the money” is the smallest it has been year-to-date.
IntoTheBlock said:
“The percentage of addresses that would make a profit if they sell their ETH positions today is 89 percent lower than the “In The Money YTD average” of 30.47 percent.”

Although most Ethereum holders are in the red, they could soon enjoy relief from the recent downturn as several technical patterns estimate that ETH is preparing for a bullish impulse.
A bullish advance is in the works
Based on its 1-hour chart, Ethereum appears to be breaking out of a symmetrical triangle where it was contained for over the past week. This technical formation represents a period of consolidation before the price is forced to break out in a positive or negative trend.
The recent move above the upper trendline can be considered the beginning of a new uptrend.
By measuring the distance between the initial high and low, the symmetrical triangle predicts a 40 percent target to the upside. An increase in the buying pressure behind Ether could see its price surge to $169 validating the bullish outlook presented by this technical pattern.

An upward move to $169 would likely bring another 7.32 million addresses that are holding over 34 million ETH “in the money,” which would be seen as a bullish sign for Ethereum's on-chain metrics. Time will tell whether demand for the smart contracts giant continues increasing to send more holders back into profits.