Bitcoin breaks $15k for first time since 2017—but this is the biggest hurdle

Cover art/illustration via CryptoSlate. Image includes combined content which may include the use of AI tools.
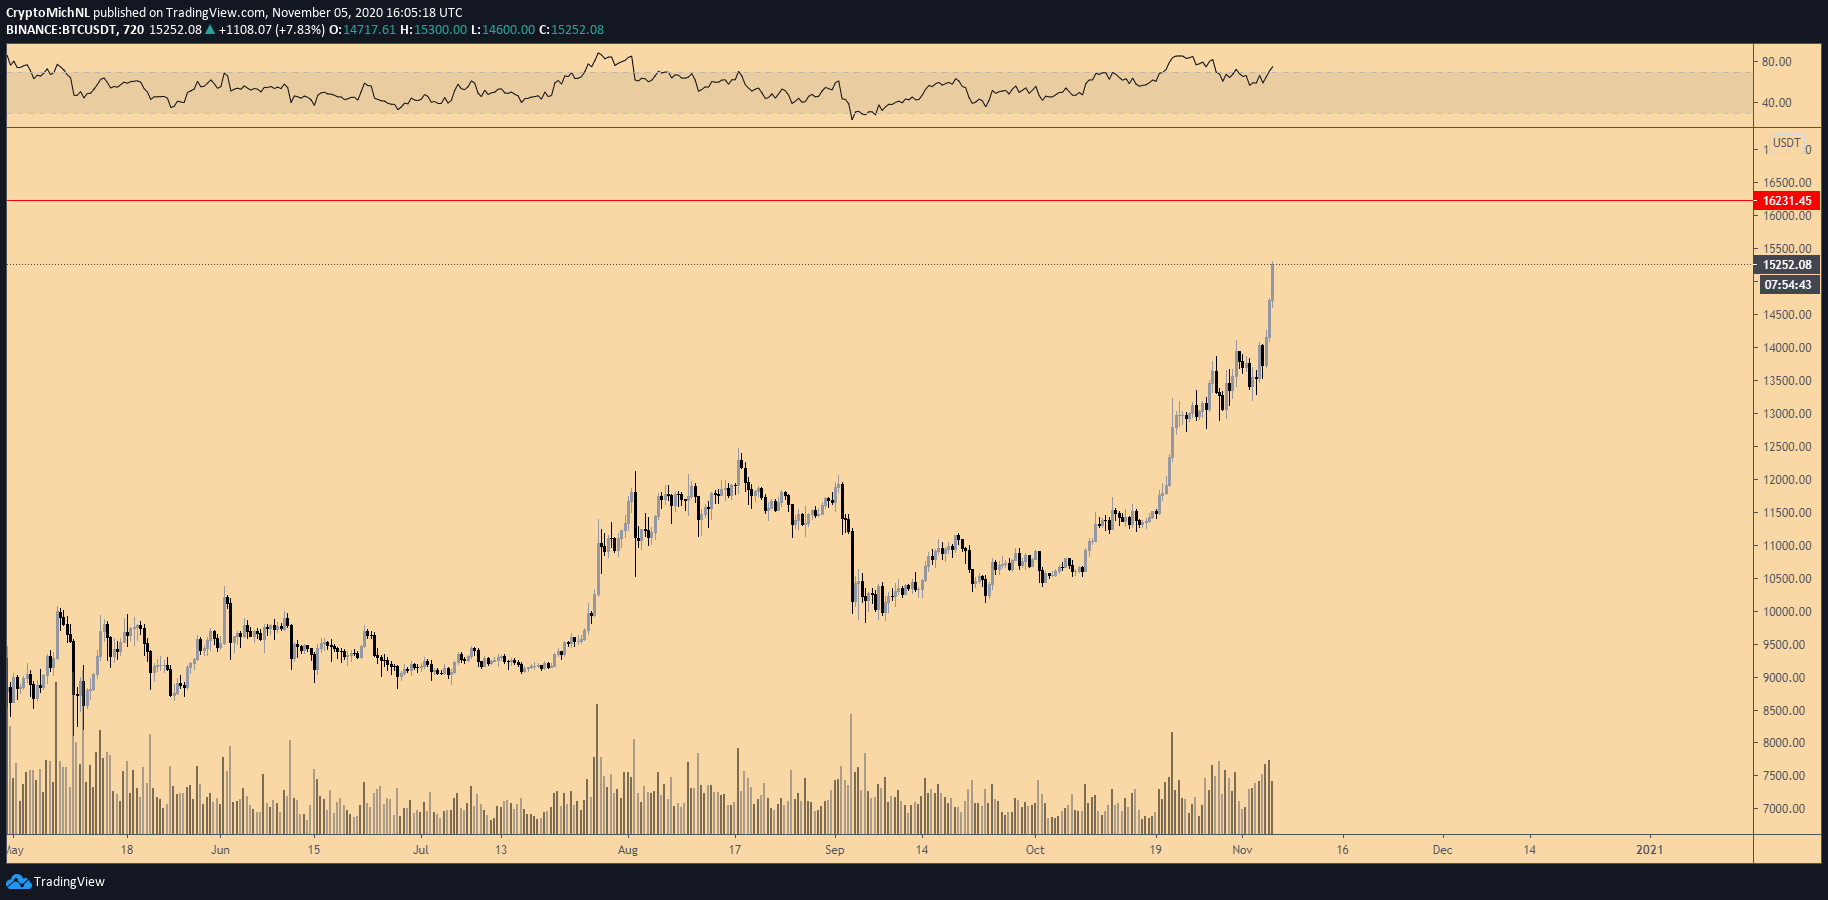
The price of Bitcoin (BTC) is demonstrating a parabolic uptrend. It has continuously surged past key resistance levels in the past 48 hours. In the near term, however, $16,000 remains the biggest hurdle.
This also means that there is no real resistance above $16,000 to the all-time high at $20,000. Based on the strong high time frame chart of Bitcoin, the road to a new record-high has become increasingly likely.
Will sellers overrun the $16k level for Bitcoin?
Throughout the past week, sellers, particularly short-sellers in the futures market, have heavily betted against Bitcoin. At $14,000 and $15,000, traders on Binance Futures especially growingly shorted Bitcoin.
As a result, the funding rate of Bitcoin consistently stayed neutral or negative, despite the ongoing steep rally.
The low funding rate of Bitcoin staying stable is critical because it suggests the spot market is leading the rally. The majority of traders in the derivatives are not buying or longing BTC, indicating the rally is not overcrowded.
Hence, if Bitcoin surpasses the $16,000 level, the path towards a new all-time high becomes relatively straightforward.
Whether Bitcoin would break out of $16,000 or see a rejection remains up in the air. Technical analysts remain uncertain about the trend of BTC, simply due to its sheer momentum.
Historically, when BTC saw a parabolic rally, it tended to overextend towards the upside. The confluence of the current momentum and the parabolic nature of the price trend suggests there is a probability of a continued breakout.
Michael van de Poppe, a full-time trader at the Amsterdam Stock Exchange, pinpointed $16,000 as the key level. He wrote:
“Last hours are showing acceleration as we're approaching next weekly level around $16,000. The U.S. stocks are also doing their work as they're up about 7% (Nasdaq) in the previous 36 hours. Let's see where $BTC will end, before or after $16K.”
On-chain data remains positive
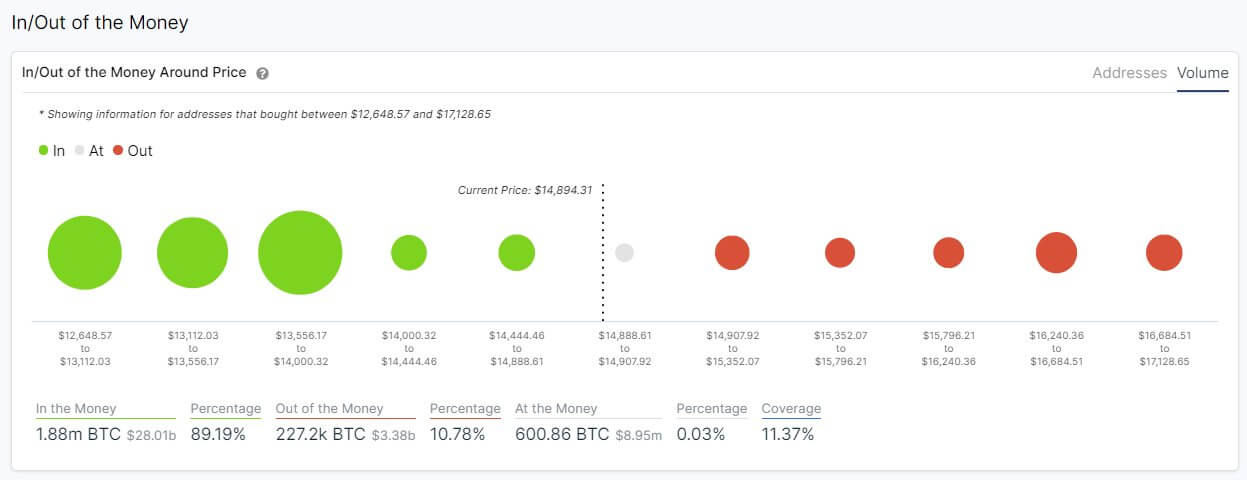
According to intotheblock, a blockchain analytics firm, the In and Out of the Money (IOMAP) suggest there is little resistance until $17,000. The analysts explained:
“We are above $15,000 again Rocket Our IOMAP indicator shows that #Bitcoin has little resistance to continue climbing towards $17,000. The biggest level of support is located between $13,556.17 and $14,000, where 1.06m addresses previously bought 763 thousand $BTC.”
If Bitcoin increases to $17,000, as the IOMAP indicator shows, then it would put BTC in a position to aim for a record-high before the year’s end.
An all-time high by the end of 2020 would put BTC in an ideal position for a broader rally in 2021, given the post-halving cycle. From 2016 to 2017, BTC rallied for 15 months after the halving.