


Bitcoin’s price drop below $78K cleared the path for a rebound as options traders hedge downside risk
Options positioning shows traders hedging $75,000 and $60,000 downside while keeping $80,000 and $90,000 rebound calls alive.

Bitcoin price breaking below $78,000 turned one of crypto’s strongest regulatory weeks into a severe test of market structure, exposing how quickly macroeconomic pressure and crowded positioning can overpower a favorable policy catalyst.
The price decline came shortly after the CLARITY Act advanced toward a Senate floor vote, a milestone that would typically strengthen the case for higher digital asset prices by reducing regulatory uncertainty.
Instead, CryptoQuant data reveals that the top cryptocurrency fell roughly $4,100 over the weekend. This sudden drop wiped out about $80 billion in market value and triggered nearly $980 million in liquidations across crypto derivatives markets.
According to market experts, the selloff highlighted that Bitcoin entered this catalyst with too much leverage.
Compounding the issue were weakening ETF demand and a macroeconomic backdrop that had grown increasingly unforgiving toward risk assets. By the time the positive policy news arrived, the market was already primed for a reset.
Thus, Bitcoin below $78,000 leaves the market in a highly complex position, with momentum stalled and short-term traders forced to cut their exposure.

Why Bitcoin price could not trade on the CLARITY Act alone
While the CLARITY Act significantly improved Bitcoin’s long-term regulatory outlook, its near-term pricing remains tethered to yields, the strength of the dollar, and global liquidity conditions.
As CryptoSlate previously reported, US Treasury yields pushed higher as investors reassessed the trajectory of Federal Reserve policy. Last week, the 10-year yield climbed toward 4.62%, while the 30-year approached 5.14%, effectively raising the discount rate across all risk assets.
Naturally, higher yields pressure Bitcoin by tightening financial conditions and making speculative assets less attractive compared to cash and bonds.
Adding another layer of pressure is the US dollar. Crypto trading firm QCP noted that the USD/JPY pair traded near 158-159, which is dangerously close to the 160 level that has historically drawn intervention from Japanese authorities.
A sharper move through this zone could trigger a partial unwind of crowded yen-funded carry trades, a mechanism that rapidly drains liquidity from global markets.
At the same time, asset management firm Bitwise noted that stress in Japanese government bonds (JGBs) fed into the broader rates narrative.
The 30-year JGB yield reached a record high, and the 10-year yield climbed to levels unseen since the late 1990s. As global investors rebalance across sovereign bond markets, rising Japanese yields often spill over into US Treasurys.

Meanwhile, US trade policy did little to ease these headwinds.
Markets had hoped for more concrete progress after the Trump-Xi summit, but the absence of clear rare-earth concessions for the US and limited detail on tariff reductions for China left investors cautious. Rising oil prices and a hotter inflation print then reinforced the view that the Fed may have less room to ease.
Consequently, rate expectations have adjusted rapidly. Markets are now pricing in a 50% to 60% probability that the Fed’s benchmark rate could be 25 basis points higher by January 2027, representing a sharp reversal from earlier base-case cut projections.
This shifting landscape makes it incredibly difficult for Bitcoin to sustain a purely regulatory-driven rally without fresh liquidity support.

Bitcoin options expiry left crowded longs exposed as ETF demand weakened
As the market grappled with these macroeconomic headwinds, Bitcoin also exhibited structural fragilities in its own trading setup, which quickly spilled over into the spot market.
According to QCP, Bitcoin had spent much of the past month comfortably hovering near $80,000. However, this stability relied heavily on options positioning that was preparing to expire.
Specifically, BTC’s spot price action was restrained by dealer positioning, largely through at-the-money gamma tied to IBIT options.
This setup naturally absorbed volatility, locking Bitcoin into a narrow range even as other assets swung aggressively. When dealers are positioned this way, their buying and selling flows mechanically dampen price movements, creating an illusion of stability.
That mechanical support evaporated after Friday’s expiry, when more than $4 billion in IBIT options rolled off. Without the stabilizing gamma effect, Bitcoin lost its firm footing near $80,000, leaving highly leveraged traders exposed in an increasingly thin market.
QCP noted that this setup made Bitcoin highly vulnerable to a liquidation cascade once the spot price broke through key support.
This is because the market had crowded into bullish positions before the regulatory catalyst could spark sustained spot demand. Once volatility spiked, long traders, who had treated the $78,000 to $80,000 range as an ironclad floor, were abruptly forced to unwind.
This liquidation wave immediately collided with a weakening spot-demand environment. Over the weekend, CryptoSlate reported that Bitcoin ETF outflows exceeded $1 billion the prior week. This was the largest weekly outflow since January.
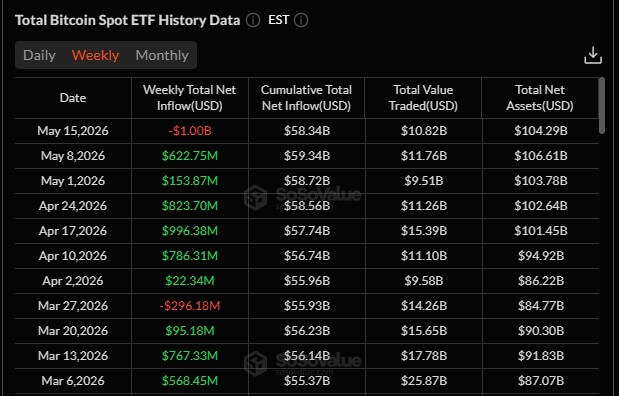
These withdrawals arrived at a critical juncture in the market, as ETF demand had previously been one of the most reliable pillars of support during Bitcoin’s recovery.
Meanwhile, Bitwise also observed that this reversal followed a period of highly elevated crypto sentiment, setting the stage for aggressive profit-taking once macro conditions deteriorated.
Ultimately, these ETF outflows changed the very character of the selloff. While the initial leg down was driven by leverage, options expiries, and the loss of mechanical support, the ETF withdrawals indicated that longer-duration buyers were also reducing their exposure.
This makes the decline much harder to dismiss as a simple derivatives-driven reset, as BTC lacked the spot demand necessary to absorb the massive leverage flush near $78,000.
Beneath the selloff, Bitcoin’s supply picture still points to accumulation
Despite the bleak short-term price action, Bitcoin's underlying network fundamentals paint a surprisingly different picture: one of quiet accumulation and a deepening supply contraction.
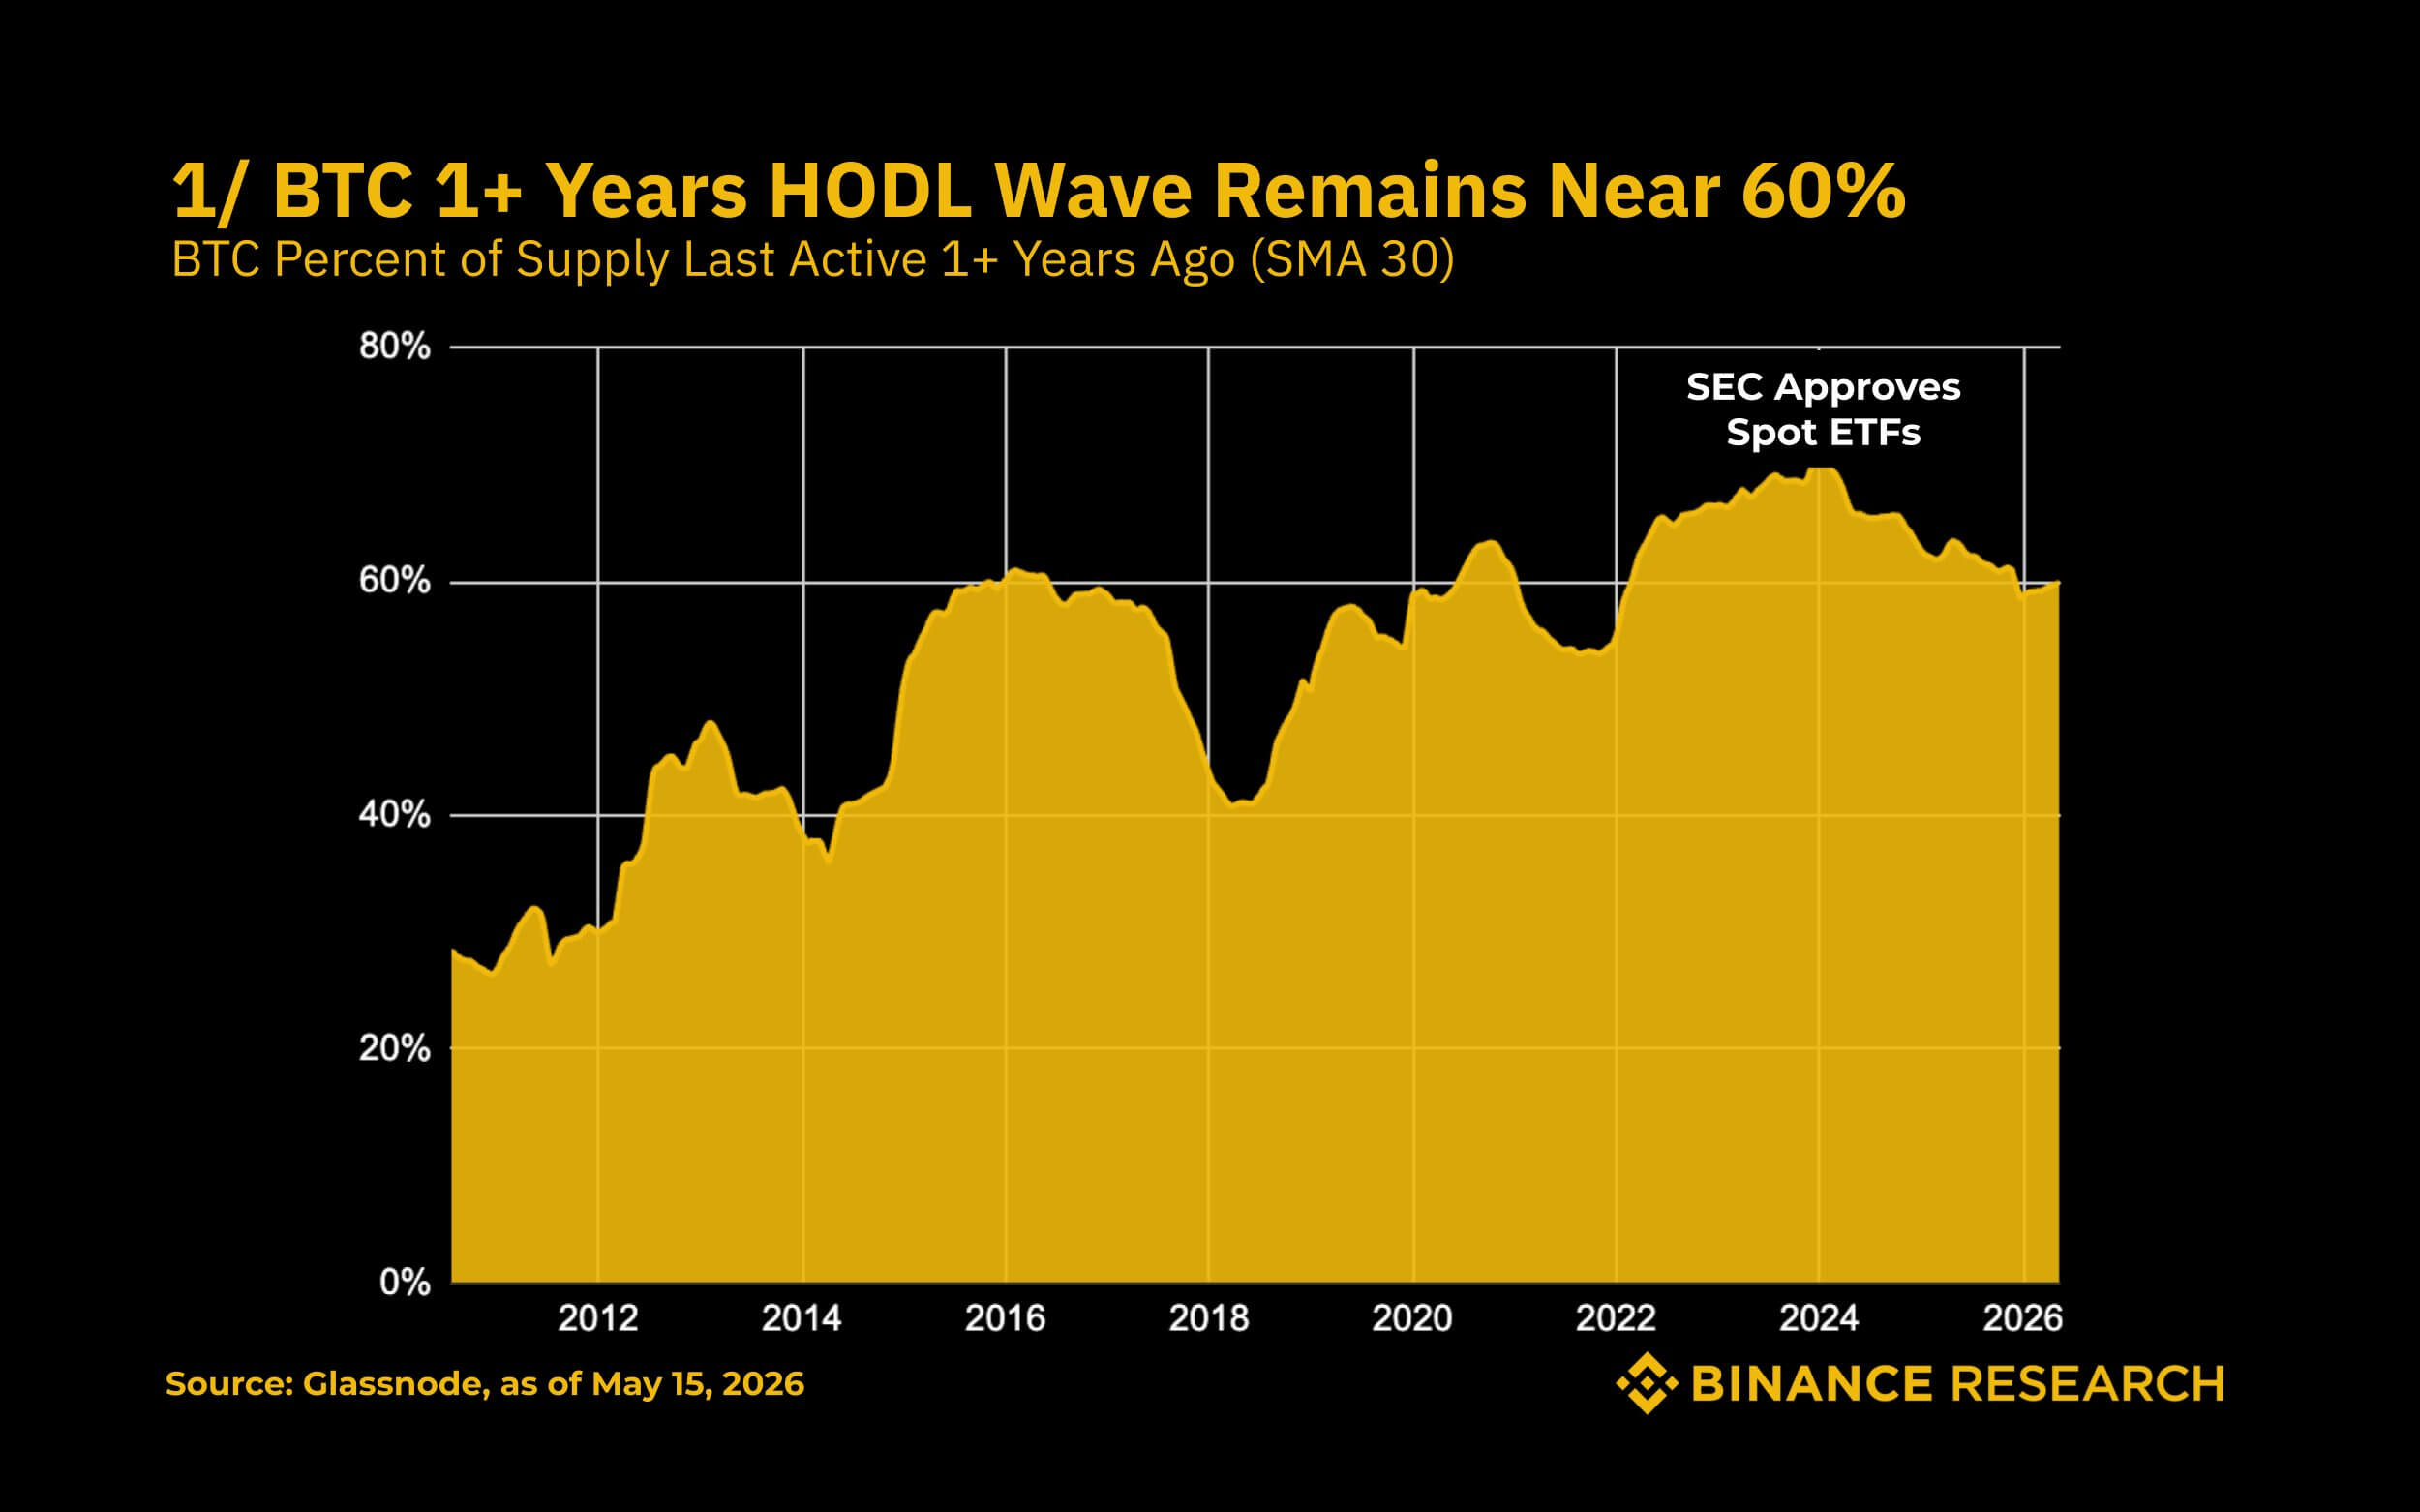
Binance Research highlighted several on-chain signals pointing toward tightening supply and fading sell pressure.
According to the firm, nearly 60% of Bitcoin’s supply has not moved in over a year, up from 27% in 2012. This dormancy peaked at 69.5% in January 2024 and remains at historically elevated levels, indicating that long-term holders still control a massive share of the supply.
This metric suggests fewer coins are rushing to market during stressful periods.
BTC's dwindling exchange balances reinforce this view. Since peaking at 17.6% during the COVID-era market shock, the share of Bitcoin held on exchanges has plummeted to roughly 15.0%. About 500,000 BTC have left exchanges over this period, driving immediately available sell-side supply to a six-year low.
Furthermore, the SLRV ratio remains in a historical bottom zone, a state where long-term holders dominate and short-term speculation is subdued. Historically, this zone aligns more closely with market accumulation phases than with distribution.
Adding to this positive structural outlook, the short-term holder MVRV measure, which stayed below 1.0 since November 2024, has finally reclaimed the 1.0 mark. This signals that short-term holders are beginning to rebuild unrealized gains, effectively exhausting immediate sell pressure.
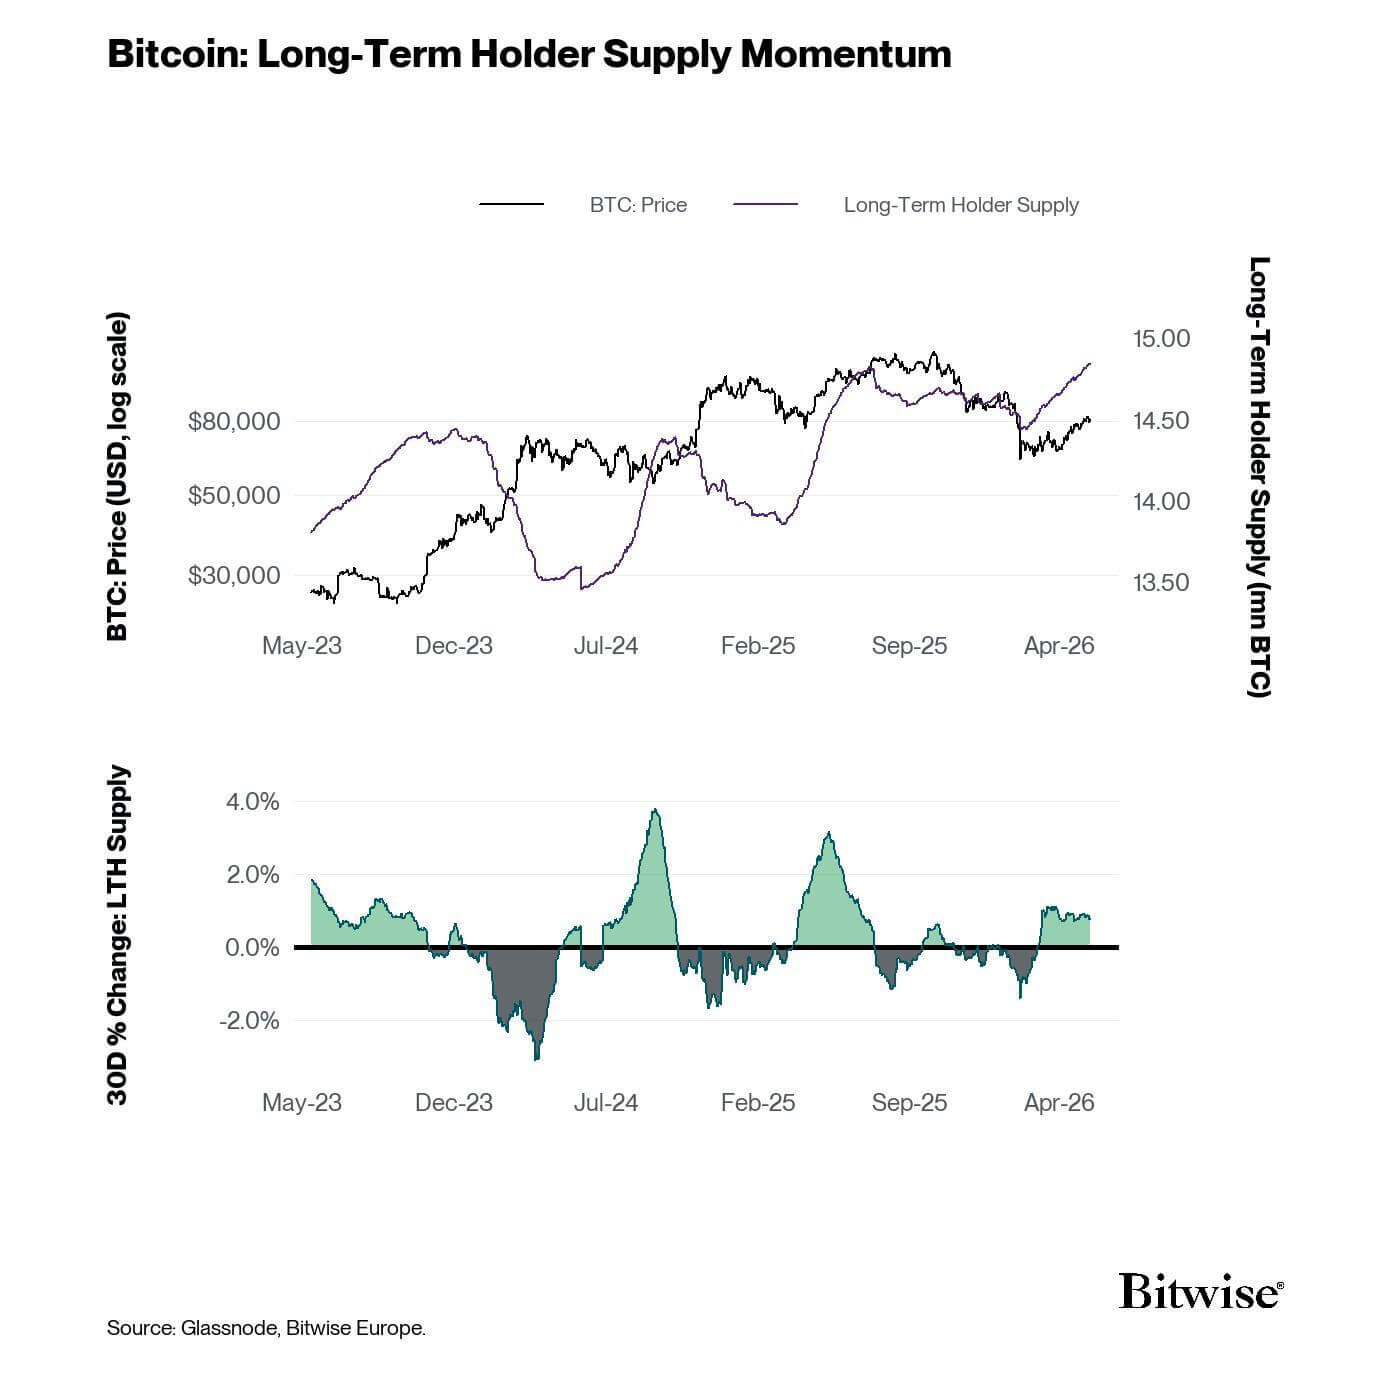
Bitwise data corroborates this dynamic, showing that long-term holder supply has swelled to roughly 14.8 million BTC, representing 74.3% of the circulating supply. Statistically, these coins are controlled by investors who are highly unlikely to panic-sell.
While these indicators do not erase the risk of near-term downside, they strongly suggest that the weekend decline flushed out excess leverage without fundamentally altering the market's deeper ownership structure.
Options traders are bracing for another leg lower while keeping the rebound trade alive
Given this complex backdrop, BTC price action and derivatives positioning indicate that crypto traders are preparing for prolonged volatility rather than a decisive directional breakout.
Deribit data shows a distinct bifurcation in market sentiment. On the defensive side, the $60,000 and $75,000 put strikes have emerged as massive positions, holding over $2.4 billion.
This reflects a strong demand to hedge against a deeper drawdown should macroeconomic pressures intensify following the break below $78,000.
At the same time, the options market still leaves room for a Bitcoin rebound if spot price reclaims the broken $78,000 to $80,000 range.
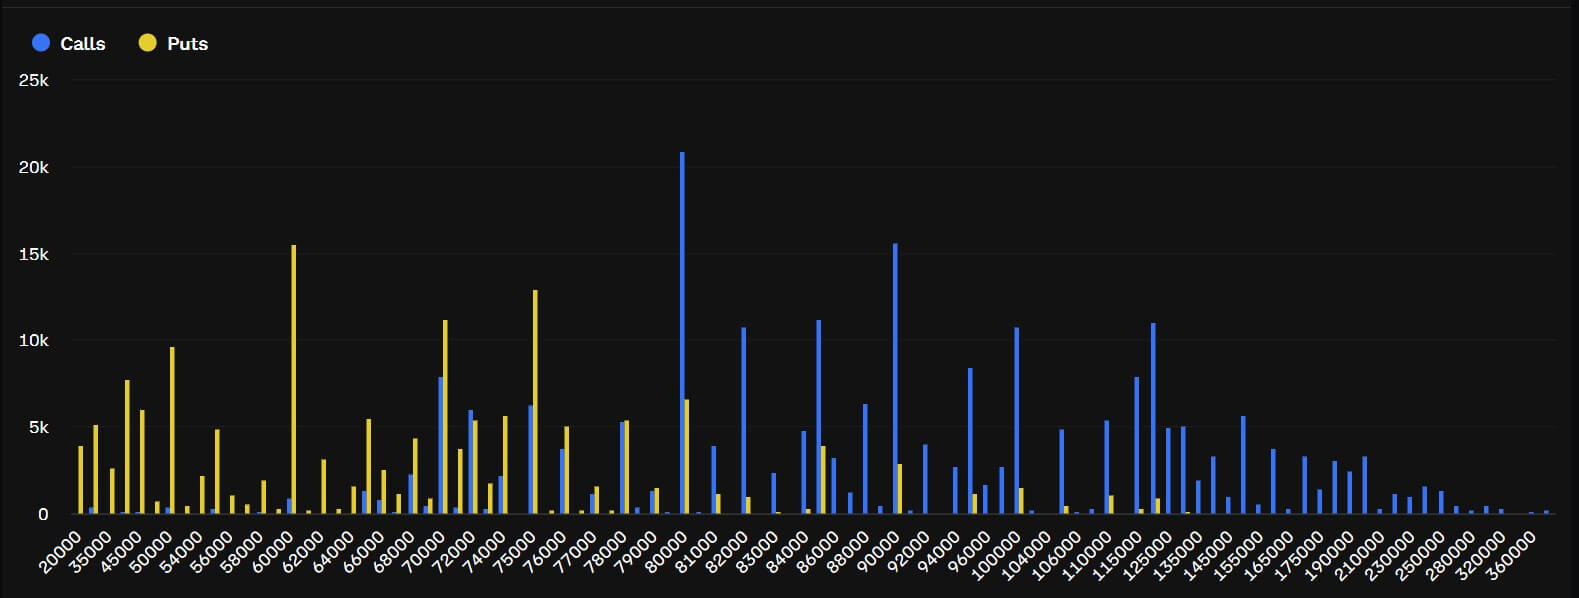
Conversely, upside potential remains robust. The $80,000 and $90,000 call strikes carry more than $2.8 billion in open interest, proving that traders haven't abandoned the rebound thesis. They are deliberately leaving room for a sharp recovery through the recently broken range.
This split positioning is a recipe for choppy price action. Large put interest can reinforce caution and accelerate selling during dips, while heavy call exposure can aggressively draw traders back in if the spot price stabilizes.
Without a definitive catalyst, call overwriters may also step back into the market to sell upside volatility, mechanically pinning Bitcoin near its current levels.
This dynamic makes the $78,000 to $80,000 zone the absolute center of gravity. A clean, decisive move back above this range would challenge the bearish positions established during the selloff, likely forcing traders to rebuild upside exposure.
On the other hand, failing to reclaim it keeps downside hedges attractive, leaving Bitcoin vulnerable to testing lower support levels.