 This technical indicator that forecasts when Bitcoin is about to turn parabolic just flashed
 This technical indicator that forecasts when Bitcoin is about to turn parabolic just flashed

Cover art/illustration via CryptoSlate. Image includes combined content which may include AI-generated content.
Despite falling into a bout of sideways trading over the past several days and weeks, Bitcoin (BTC) and the aggregated cryptocurrency markets have been able to post massive gains from their late-2019 lows.
The uptrend incurred by BTC over the past few weeks appears to have altered its market structure to favor buyers, and the crypto has been able to post multiple bullish technical signs.
Now, one well-respected technical indicator that predicted the start of previous parabolic rallies is flashing again, which may signal that Bitcoin could be on the edge of seeing some serious upwards momentum.
Bitcoin bounces from key support as bulls fight back
At the time of writing, Bitcoin is trading up just under 1 percent at its current price of $8,450, which marks a notable climb from 24-hour lows of $8,200 that were set late yesterday.
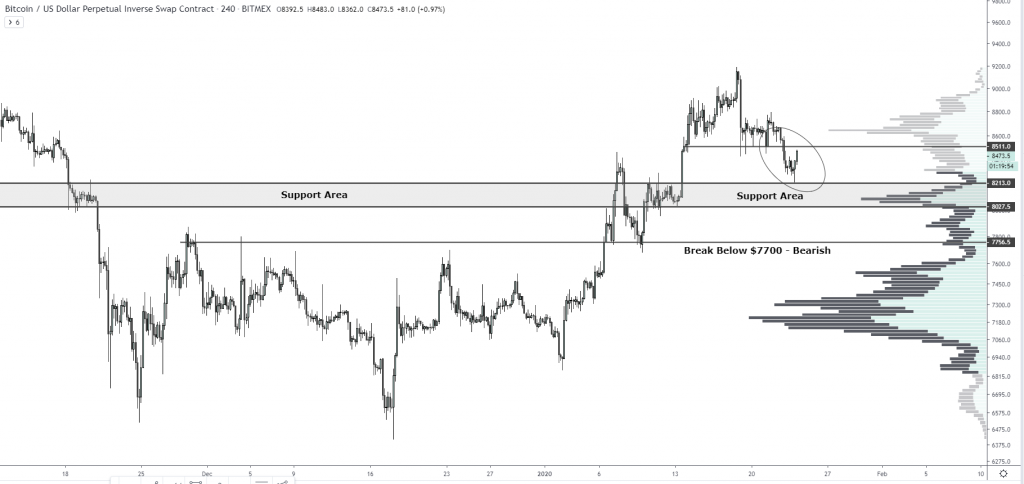
The recent drop to lows of $8,200 marked an extension of the downwards momentum that was first generated when BTC was rejected at its intra-rally highs of $9,200, but bull’s ability to defend this level in spite of intense selling pressure is certainly a positive sign.
Josh Rager, a prominent crypto analyst on Twitter, spoke about the defense of this support level in a recent tweet, explaining that he is neutral on BTC in the near-term until it pushes to the upper-$8,000 region. He said while referencing the below chart:
“BTC bounced off the support. I’m sure people have flipped bullish again, but neutral now as price needs to continue to push to high $8ks. Mid-range isn’t safe to buy if you’re thinking of rushing in, be patient as this could break back down to retest $8000 – $8200 (lower-highs).”

This bullish indicator just flashed; is BTC about to go parabolic?
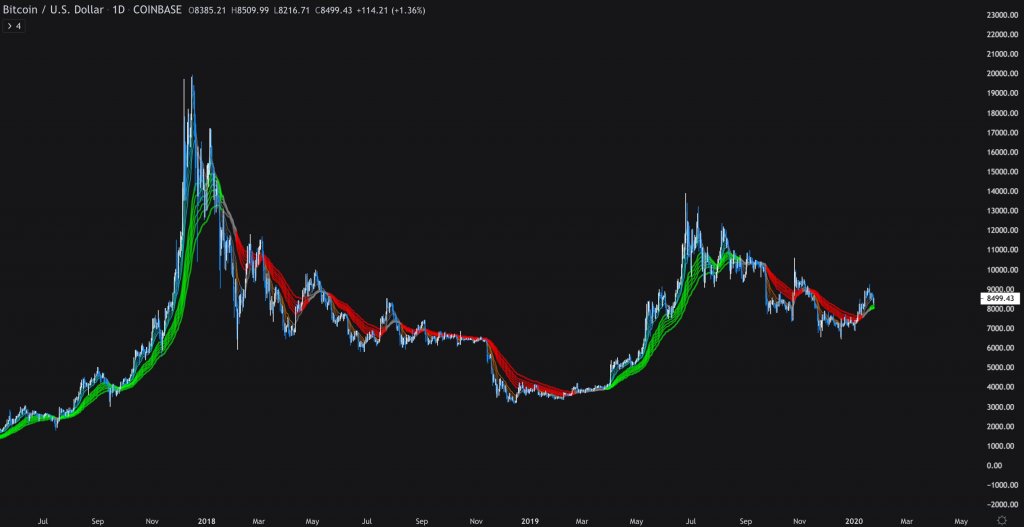
One factor that should be noted is that Bitcoin’s guppy indicator, which is a technical indicator that helps traders forecast future trends, recently turned green, which is something that only happens before BTC enters parabolic phases. Hsaka, another popular crypto analyst, explained while pointing to the indicator seen below:
“BTC 1D: Guppy has gone green. Surprised how this flew under the radar considering this was one of CTs favourite meme back in ’18.”

Although BTC may not have any clearly defined near-term trend as it continues to range within the mid-$8,000 region, the strength of the 2020 bull market may ultimately be enough to help propel the crypto significantly higher in the near-term.
Bitcoin Market Data
At the time of press 1:53 am UTC on Jan. 28, 2020, Bitcoin is ranked #1 by market cap and the price is up 4.97% over the past 24 hours. Bitcoin has a market capitalization of $165.33 billion with a 24-hour trading volume of $29.72 billion. Learn more about Bitcoin ›
Crypto Market Summary
At the time of press 1:53 am UTC on Jan. 28, 2020, the total crypto market is valued at at $250.11 billion with a 24-hour volume of $110.77 billion. Bitcoin dominance is currently at 66.09%. Learn more about the crypto market ›


 Deribit


