Technicals show Bitcoin is in ‘poor shape’ — what happens next?
Macroeconomic factors continue to weigh heavy on Bitcoin, this appears reflected in the technicals.

Cover art/illustration via CryptoSlate. Image includes combined content which may include the use of AI tools.
The Bitcoin price has been declining since April 6, having posted a local high of $46,700.
A lull over the weekend saw BTC caught in a tight trading range between $42,100 and $43,400. But Monday saw further drops resulting in a 7% swing to the downside, taking BTC below $40,000 for the first time since mid-March.
The buyers are mounting a fightback today, but volume remains low. Nonetheless, buyers have managed to lift BTC back above $40,000. The current price is hoovering precariously close to that level, at $40,500 at the time of writing.
Driving this current downturn is the uncertain geopolitical situation we face.
Macro factors weigh heavy on Bitcoin
As reported by CryptoSlate, inflation and the cost of living crisis are significant concerns, with the White House tweeting expectations for “extraordinarily elevated” levels.
The Fed is widely expected to continue tightening monetary stimulus combined with scaled-back growth expectations, resulting in headwinds for global asset prices — more so for crypto and other risk-on assets.
Tightening monetary stimulus refers to a central bank winding down, or tapering, its asset purchases, which does not necessarily mean selling acquired assets. However, it is considered a precursor to higher interest rates.
This course of action stifles the debt market leading to less available liquidity for asset purchases. Thus the demand for risky assets will lessen, creating a situation where there are more sellers than buyers.
Technology Attorney Andrew Rossow commented that the Fed is looking at tapering around $95 billion a month, which he described as “extremely aggressive.”
“Earlier this week, the Fed announced that it would be reducing the central bank’s balance sheet by ‘trillions of dollars’ in bond holdings by approx. $95 billion a month – this is an extremely aggressive balance reduction in the central bank’s attempts to tighten its monetary policy with inflation rising.”
The Head and shoulders pattern is still in play.
With macroeconomic factors hindering Bitcoin, technical analysis from Francis Hunt, aka the Market/Crypto Sniper, also paints a grim outlook. According to Hunt, the Bitcoin price pattern shows technical weakness.
Hunt expands on this by saying, although the price structure did not break down as expected, a failure to hit $52,000 means the head and shoulders pattern is in play.
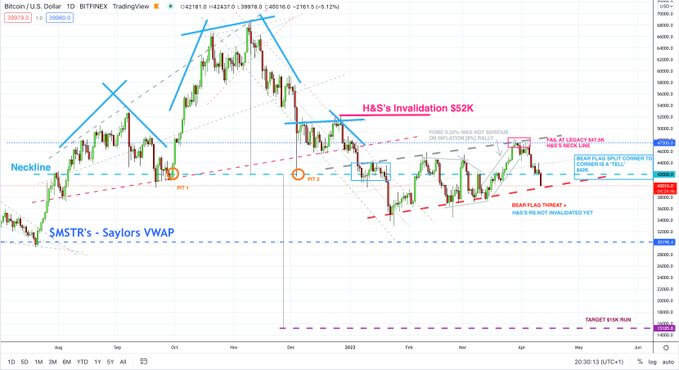
The head and shoulder pattern appears as a baseline with three peaks. The two outside peaks are close in height, with the middle peak being the highest. It maps out a continuous “tug of war” between buyers and sellers, the right peak or the second decline shows sellers are winning.
BITCOIN is in poor shape technically, After reluctantly accepting the squeezing structure was not a downside break as expected, this is what I now see of danger:
1. The H&S's [$69K] with $42K neckline, needed a $52K run for invalidation. NOT happened yet.@raoulGMI pic.twitter.com/zvccaitT0b
— TheCryptoSniper (@TheCryptoSniper) April 11, 2022
The inability to surpass the highest high signals that buyers are defeated, and typically, at this point, sellers take control to drive the price down and complete the reversal.