On-chain data showed FTX was in trouble right before it collapsed
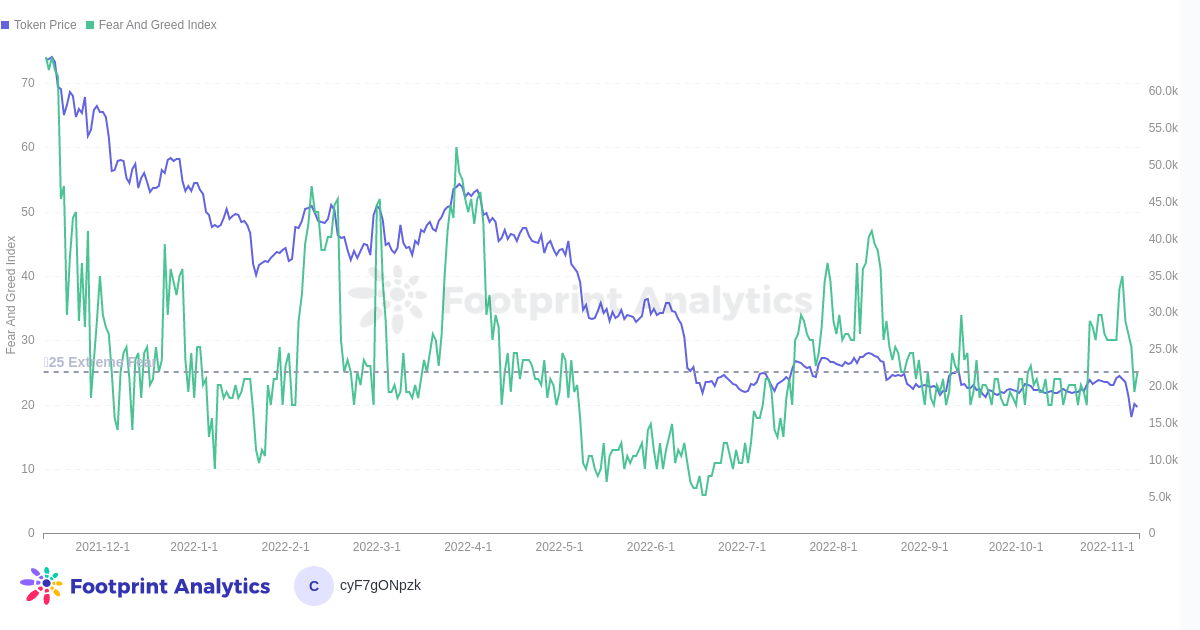
The collapse of FTX put the market once again into a state of extreme fear, with BTC falling down to its lowest level of the year at $16,000.
Cover art/illustration via CryptoSlate. Image includes combined content which may include the use of AI tools.
On Nov. 2, Coindesk sparked crypto history’s biggest collapse yet after it released the private financial documents of Alameda Research, a VC and trading firm owned by FTX founder Sam Bankman-Fried and closely tied to the exchange.
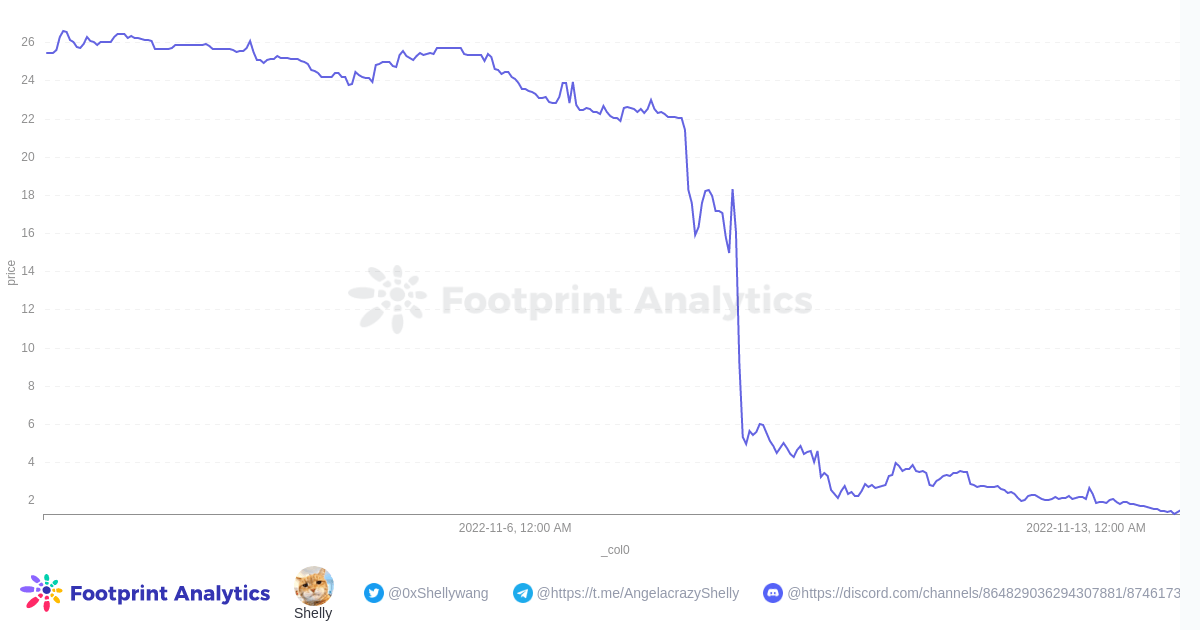
In the ensuing week, 140M FTT flowed to Binance, and the token fell from $26 to below $2. This triggered a run on FTX, a supposed “hack” draining $473 million from the reserves, and the declaration of bankruptcy by the world’s second-largest trading platform.
Summary of events
- Nov. 2: Coindesk releases Alameda’s private financial documents.
- Nov. 6: Binance founder CZ posts that Binance will sell off all FTT coins on its book in the coming months. Alameda CEO Caroline Ellison offers to buy all of Binance’s FTT holdings at $22.
- Nov. 6: FTT experiences its first sharp drop (10% down) and goes back to $24 after Ellison’s offer.
- Nov. 8: FTX International suspends withdrawals.
- Nov. 8: FTT plummets to $5
- Nov. 8: Binance announces it might be interested in acquiring FTX.
- Nov. 11: Acquisition terminated.
- Nov. 11: FTX files for bankruptcy and users' funds disappear.
How the FTX collapse impacts the entire crypto market
The collapse of FTX put the market once again into a state of extreme fear, with BTC falling down to its lowest level of the year at $16,000.
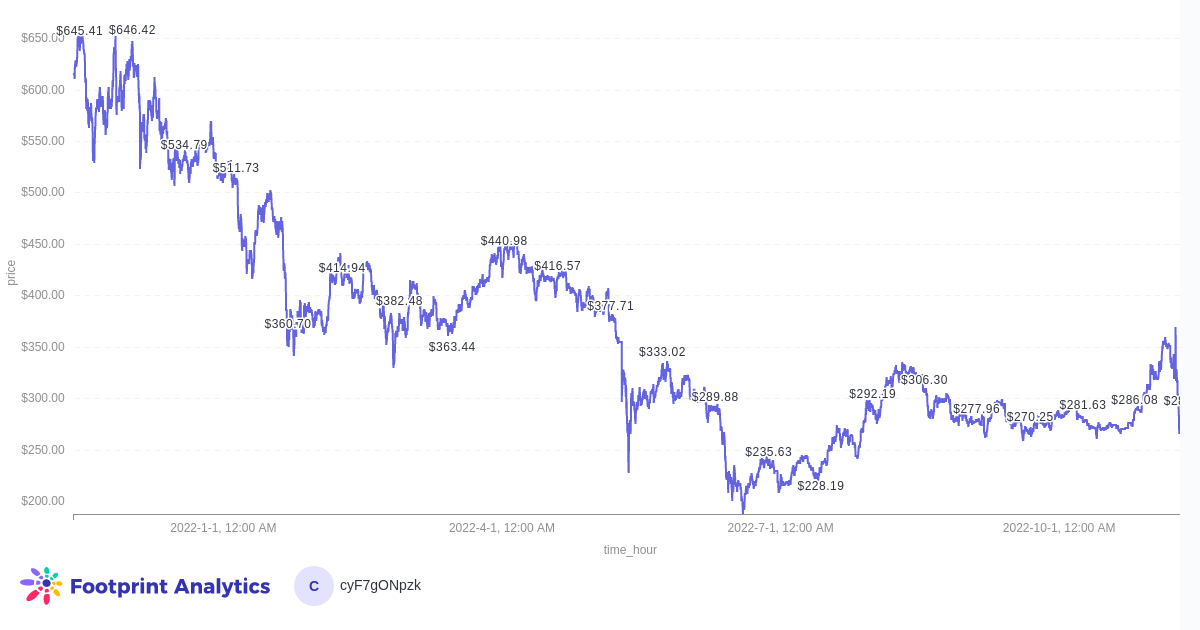
At first glance, it would seem like Binance came out as the winner in this situation, with countless memes jokingly showing CZ as the genius mastermind behind his top competitor’s fall. While BNB jumped to $368 for a short period of time on Nov. 8, it quickly dropped back down to a near 3-month low of $264. The situation has made the entire industry appear extremely trustworthy, and centralized exchanges will feel the brunt.
What on-chain data could have told us
Before the collapse of FTX became imminent, there were serious on-chain signals that indicated trouble ahead.
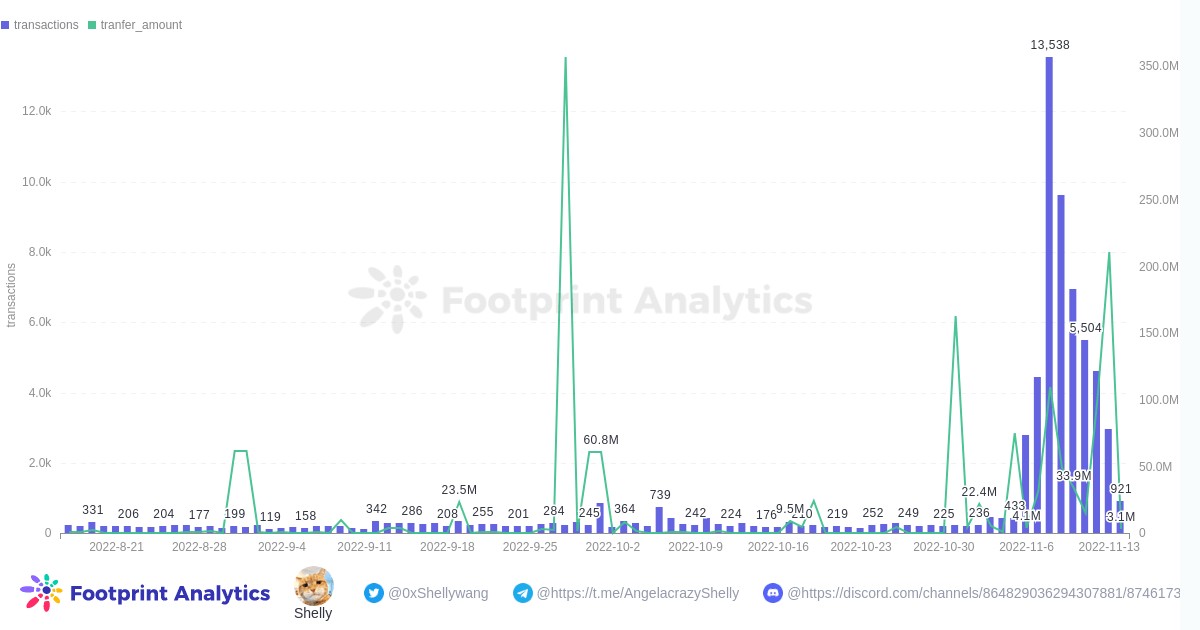
On Nov. 5, 75M FTT was transferred off FTX, indicating a sell-off after this incident. We also witnessed two major dumps on FTT on Nov. 8 & Nov. 13, with around 110M and 211M, respectively.
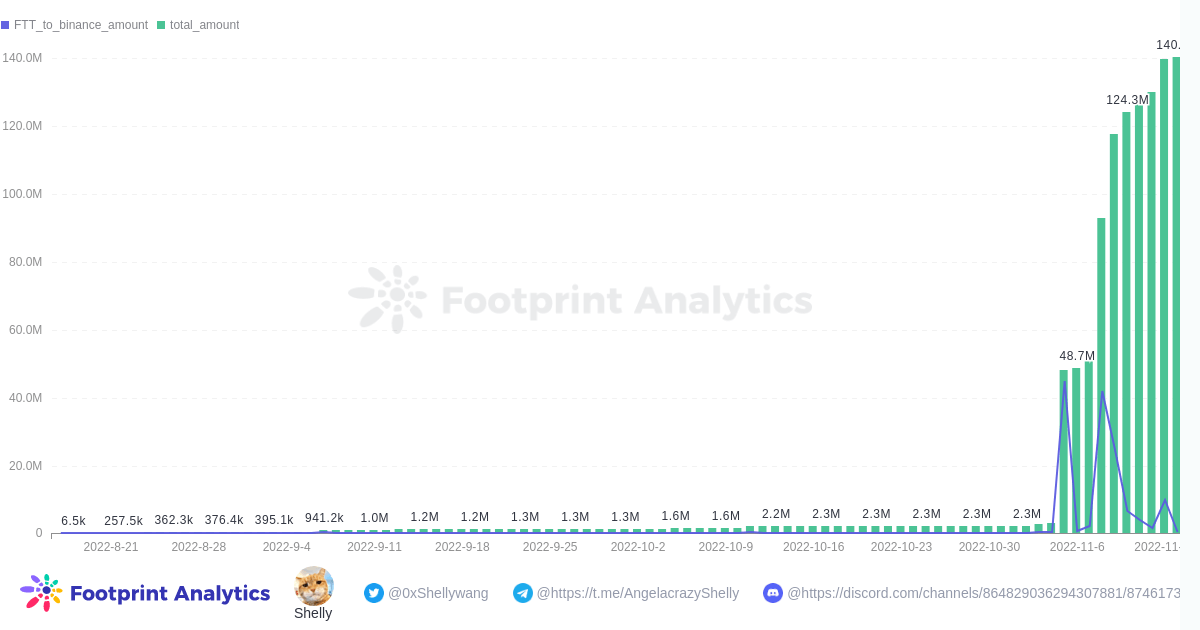
More than 140M of FTT tokens were transferred to Binance from Nov 2 to Nov 8. The jump in transaction volume began on the 5th and 6th, with around 45M and 42M, respectively.
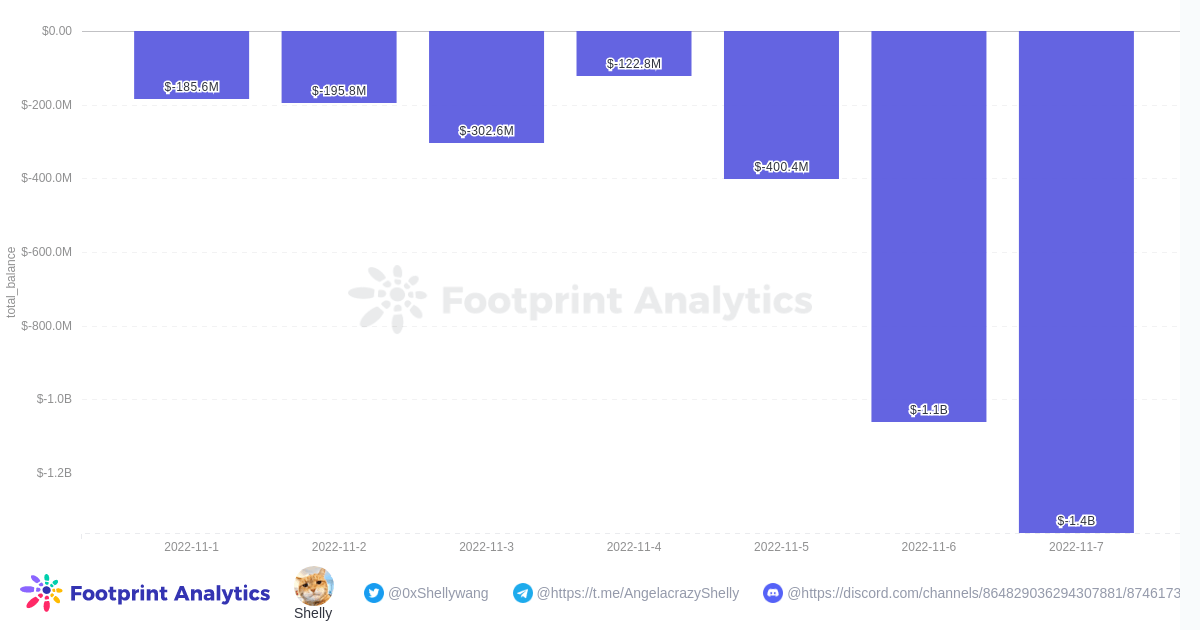
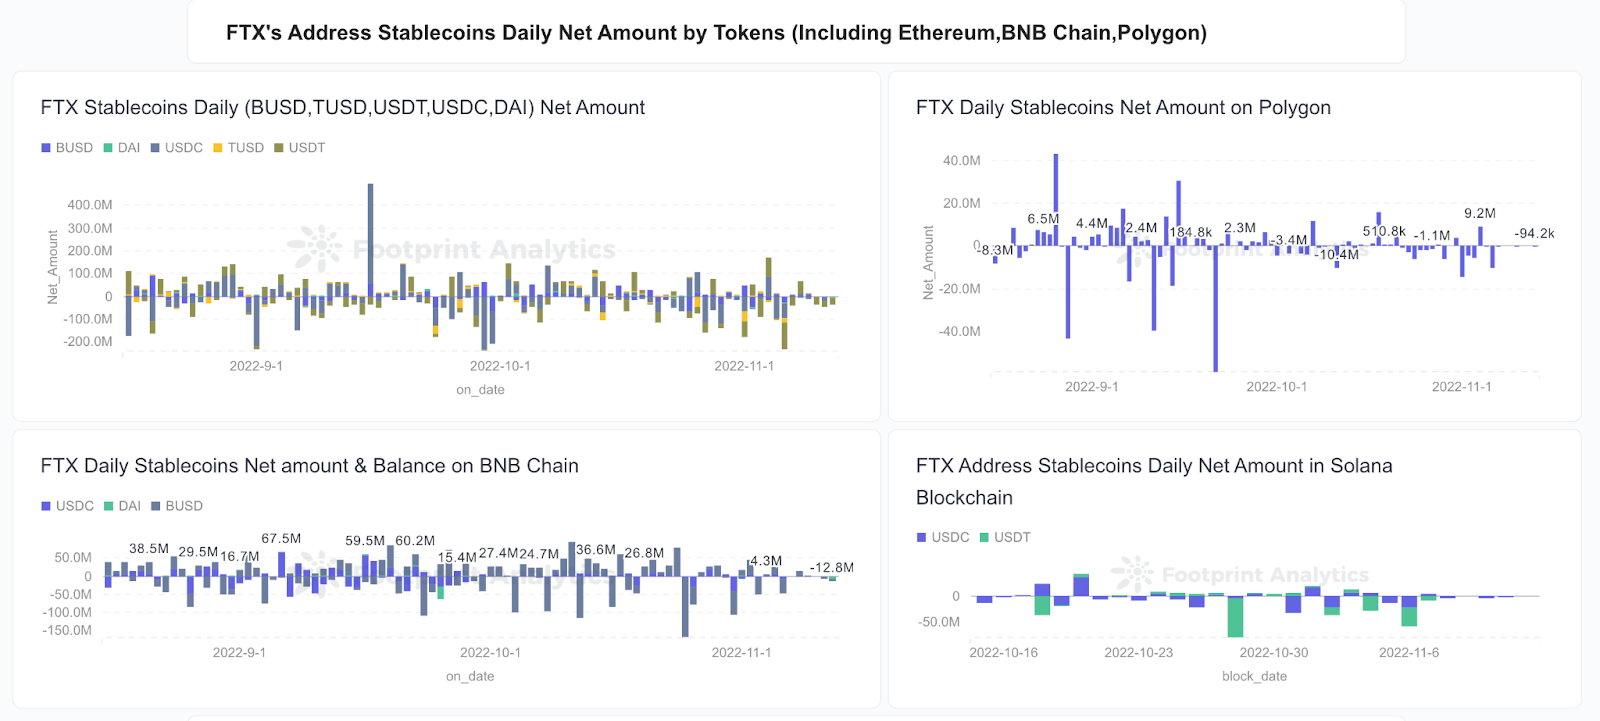
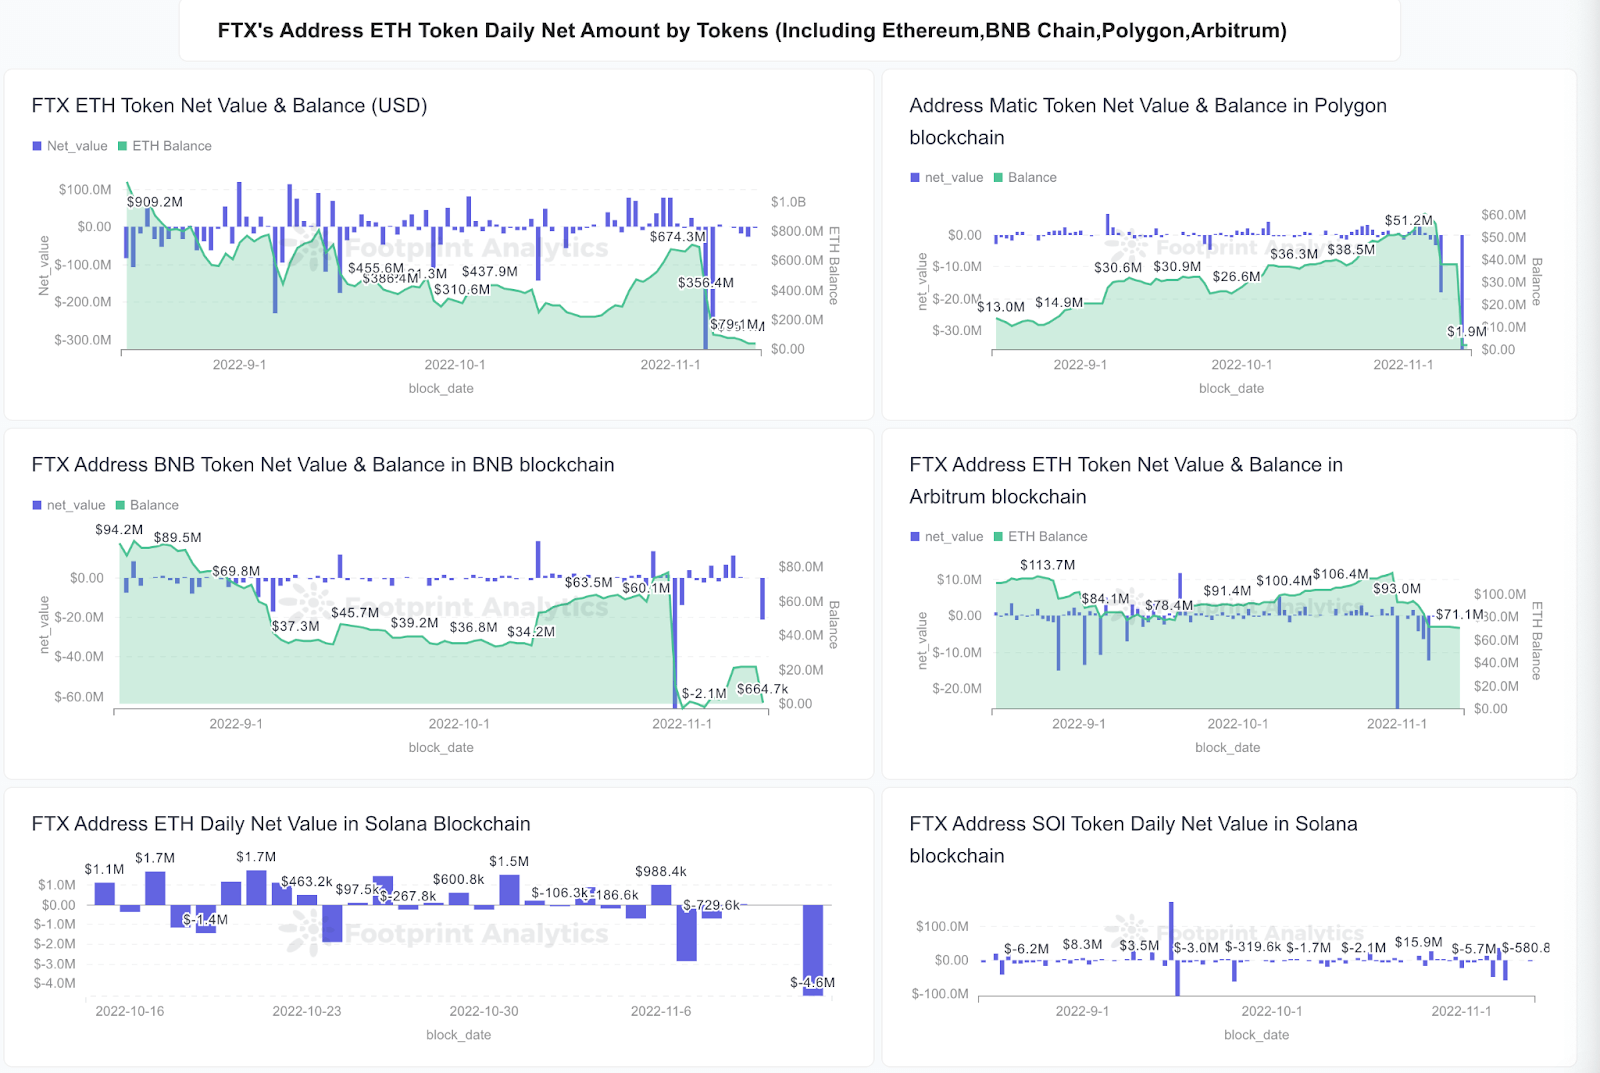
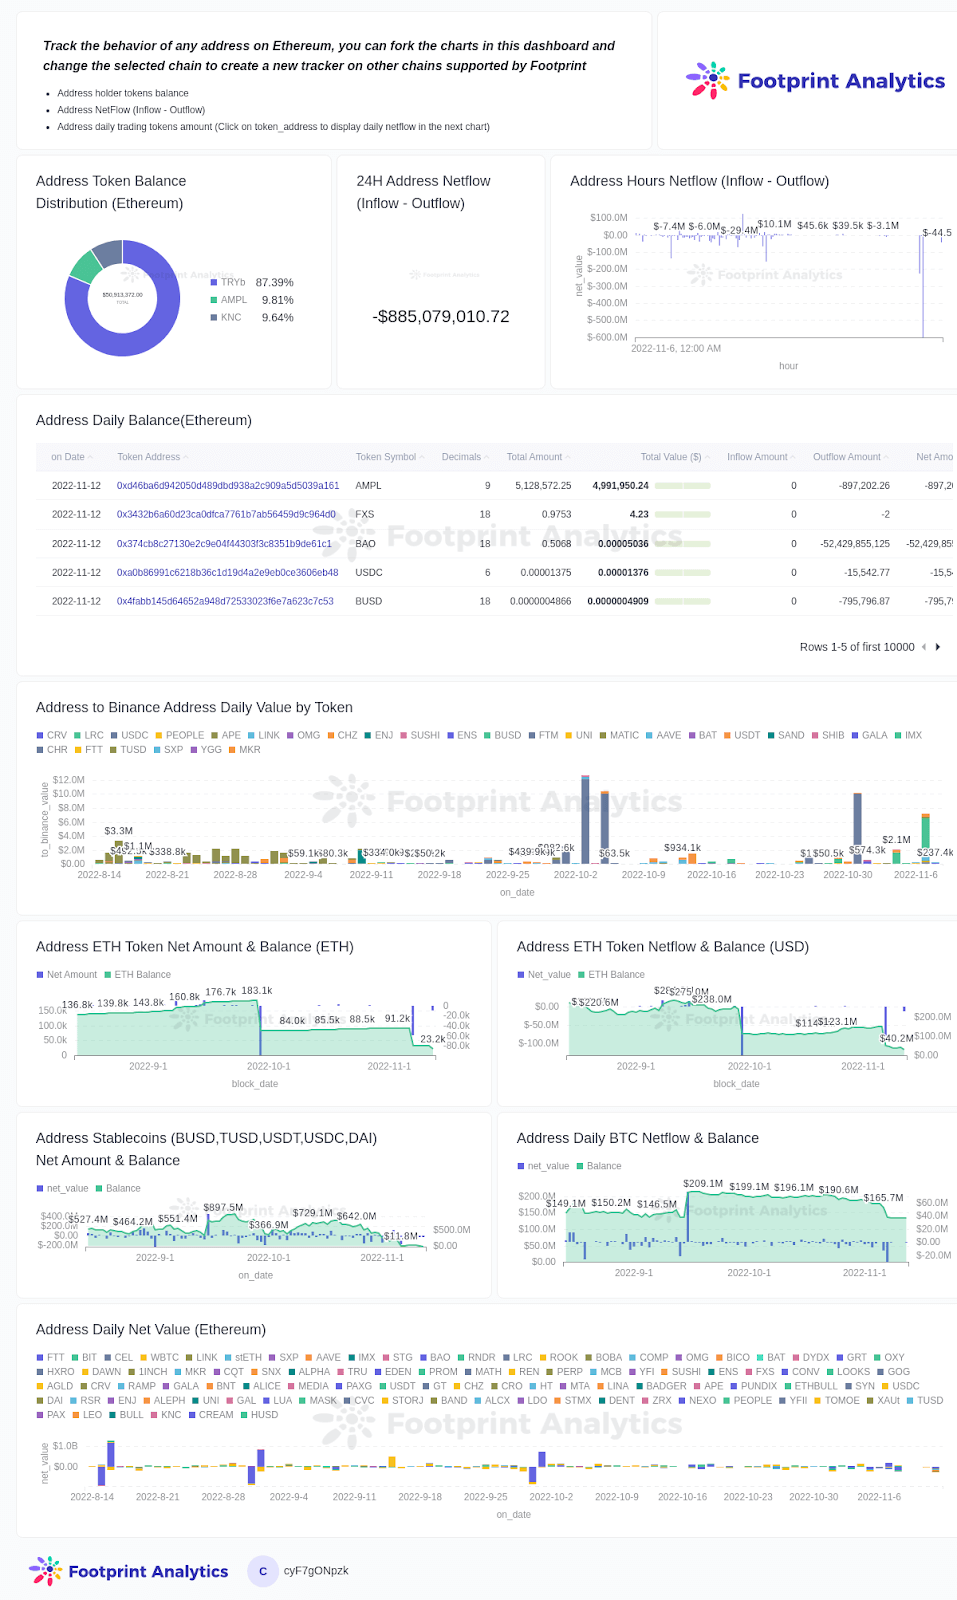
More than $1.4B has drained from FTX’s Ethereum balance.
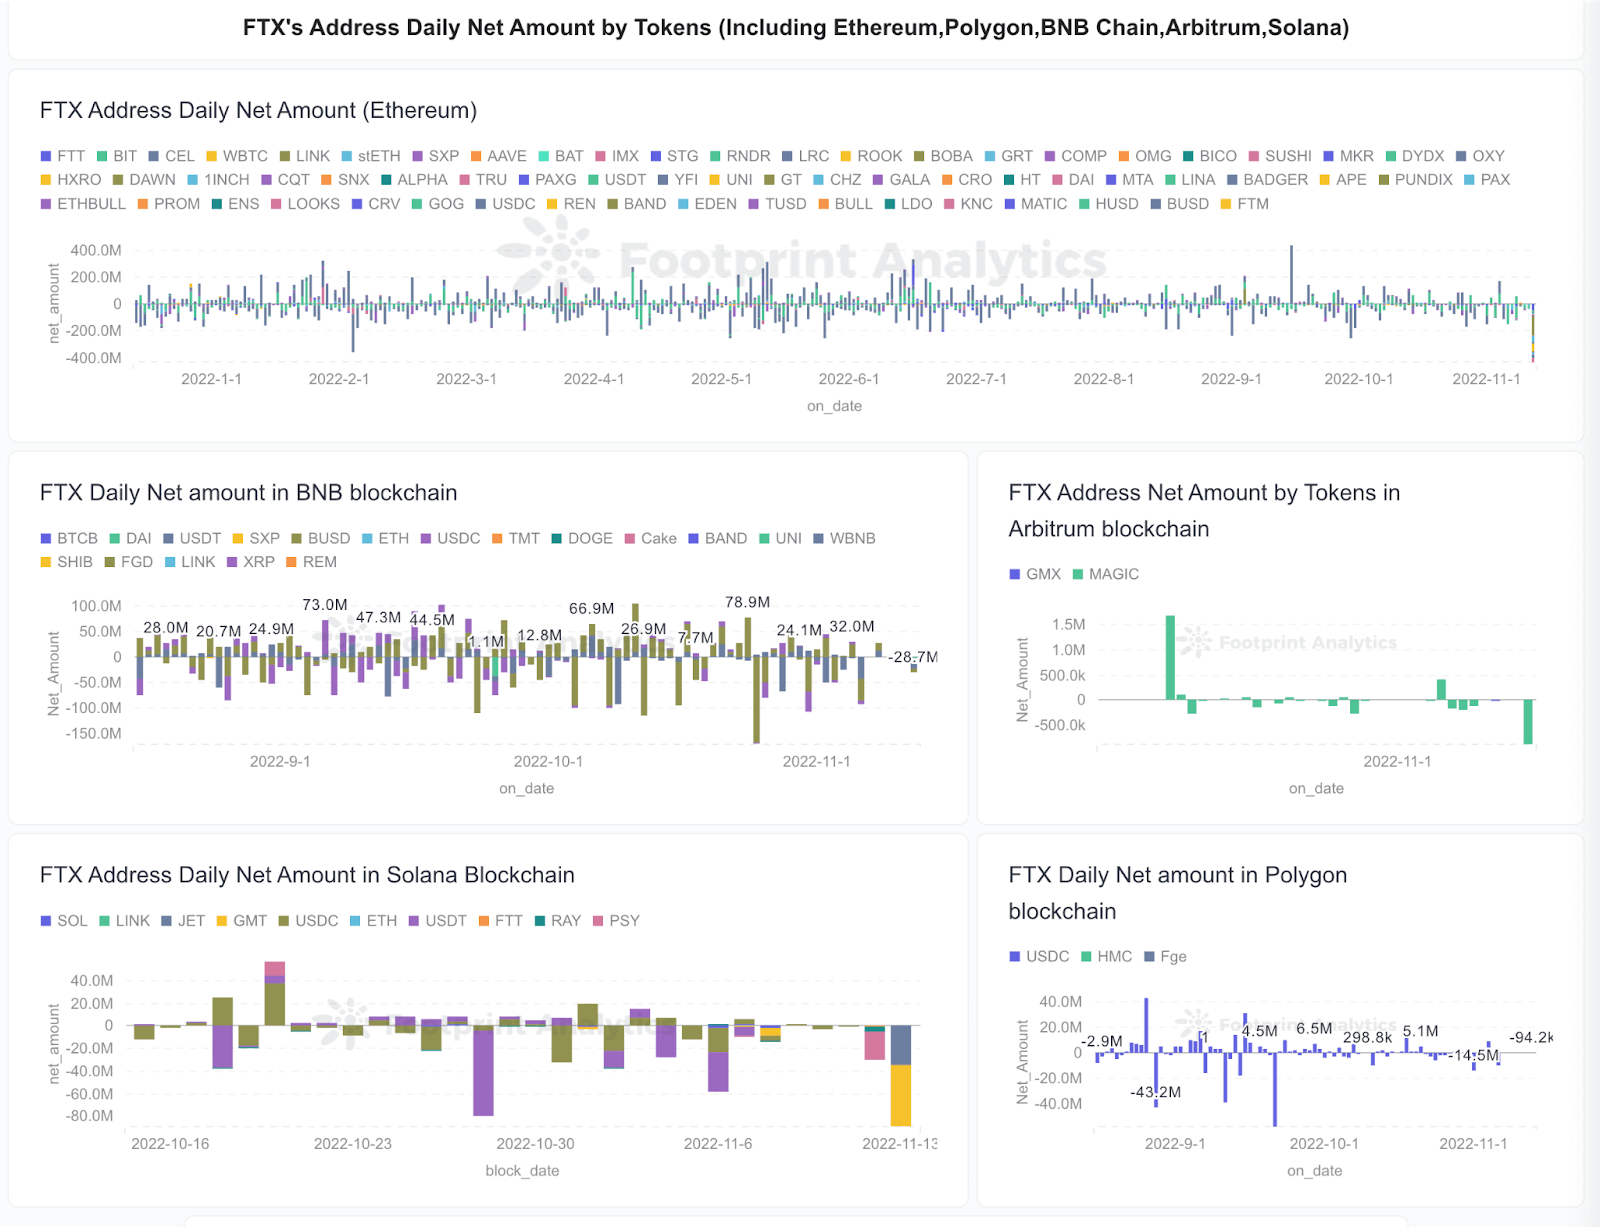
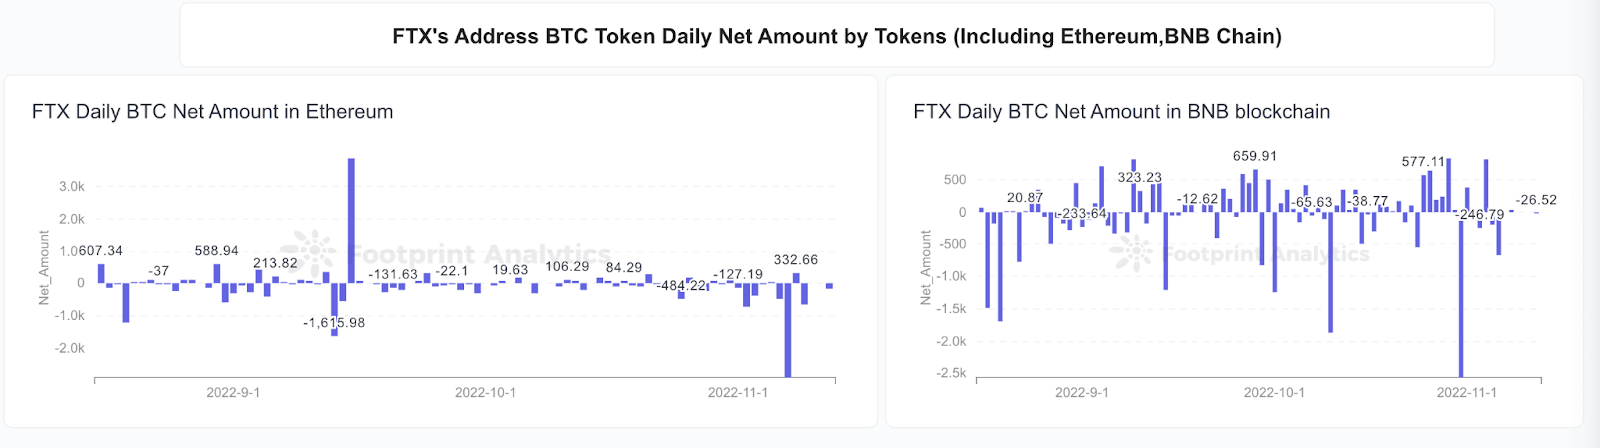
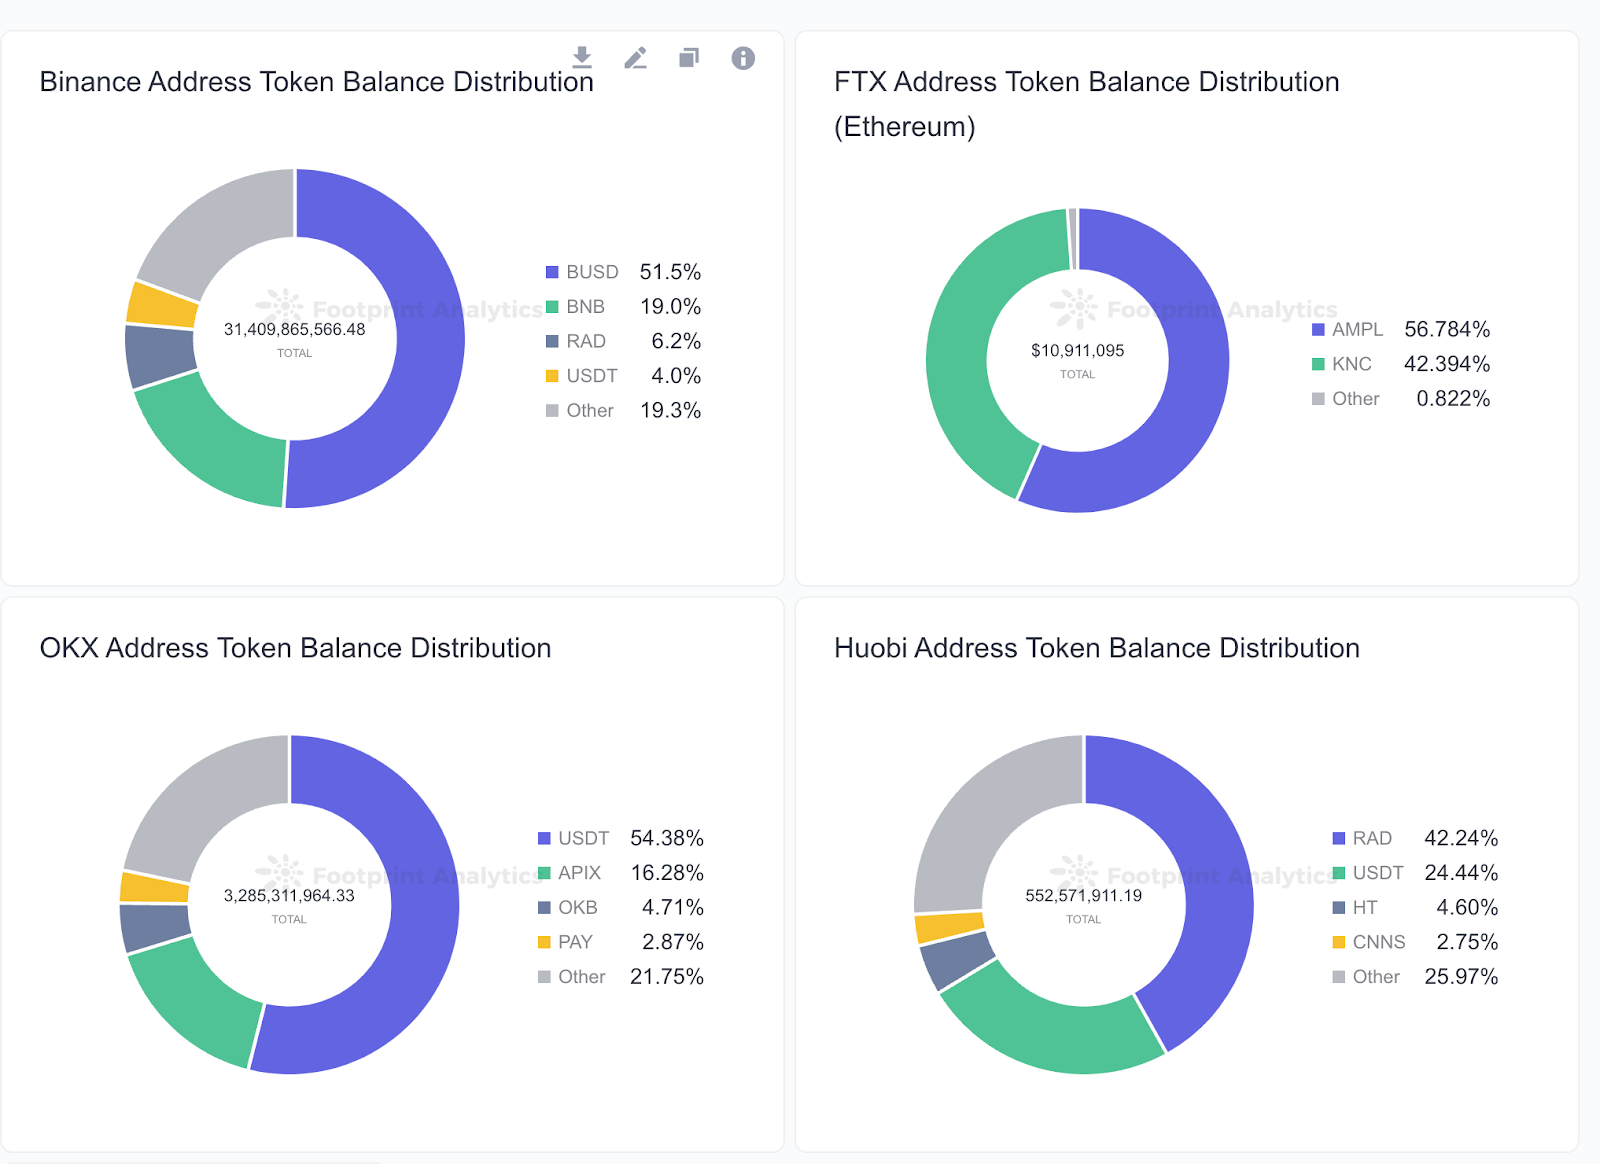
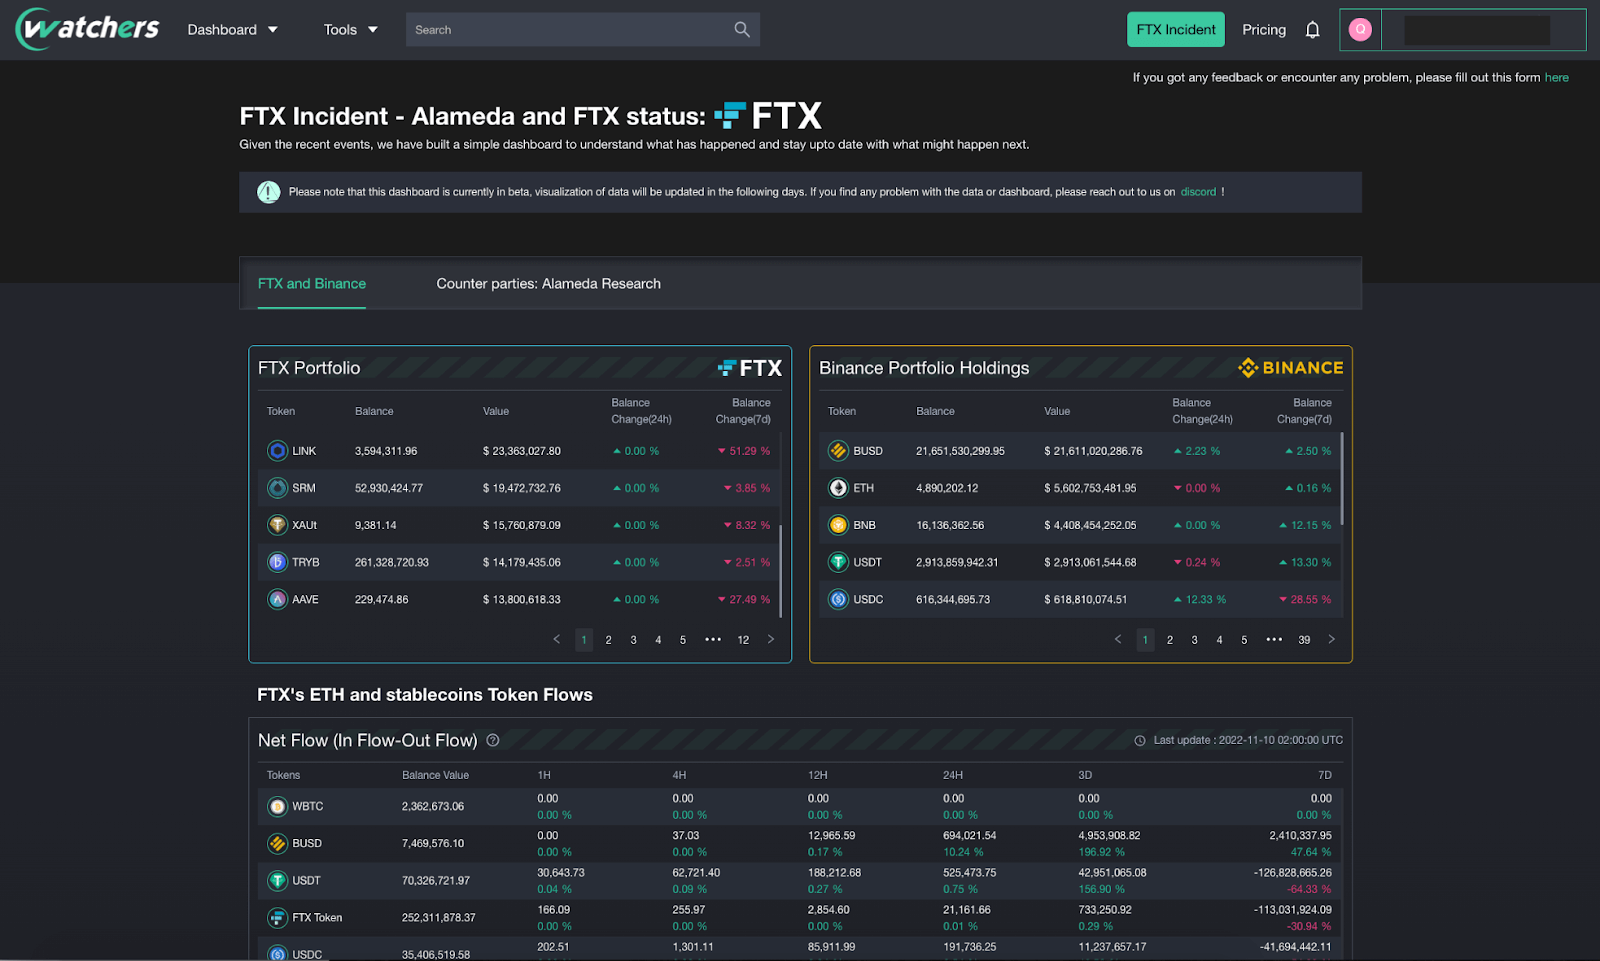
FTX’s major tokens balance dropped significantly.
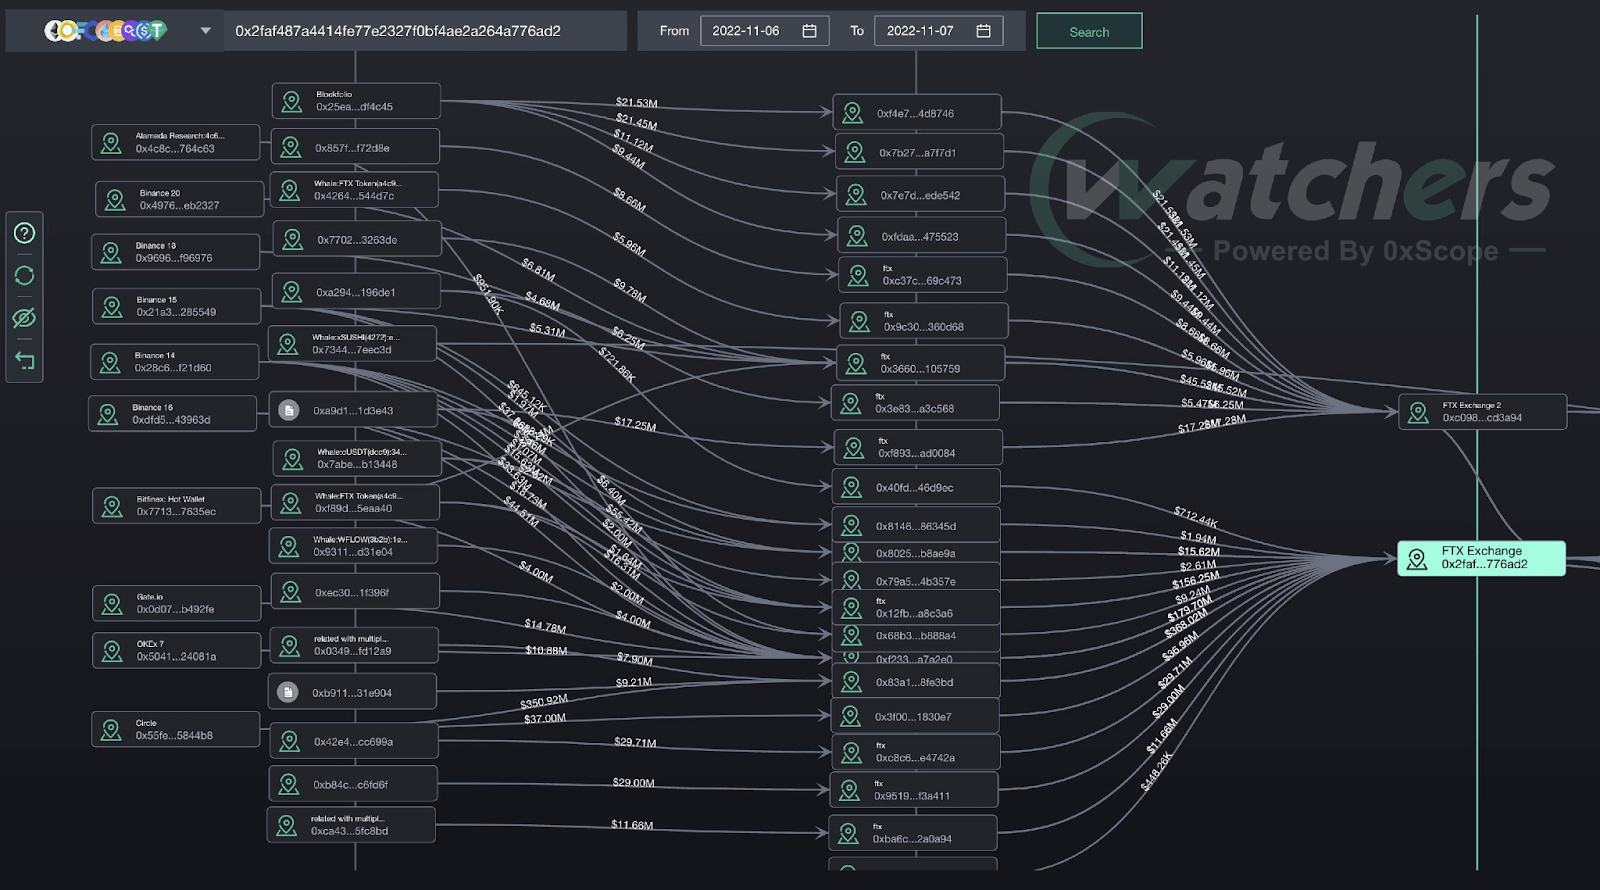
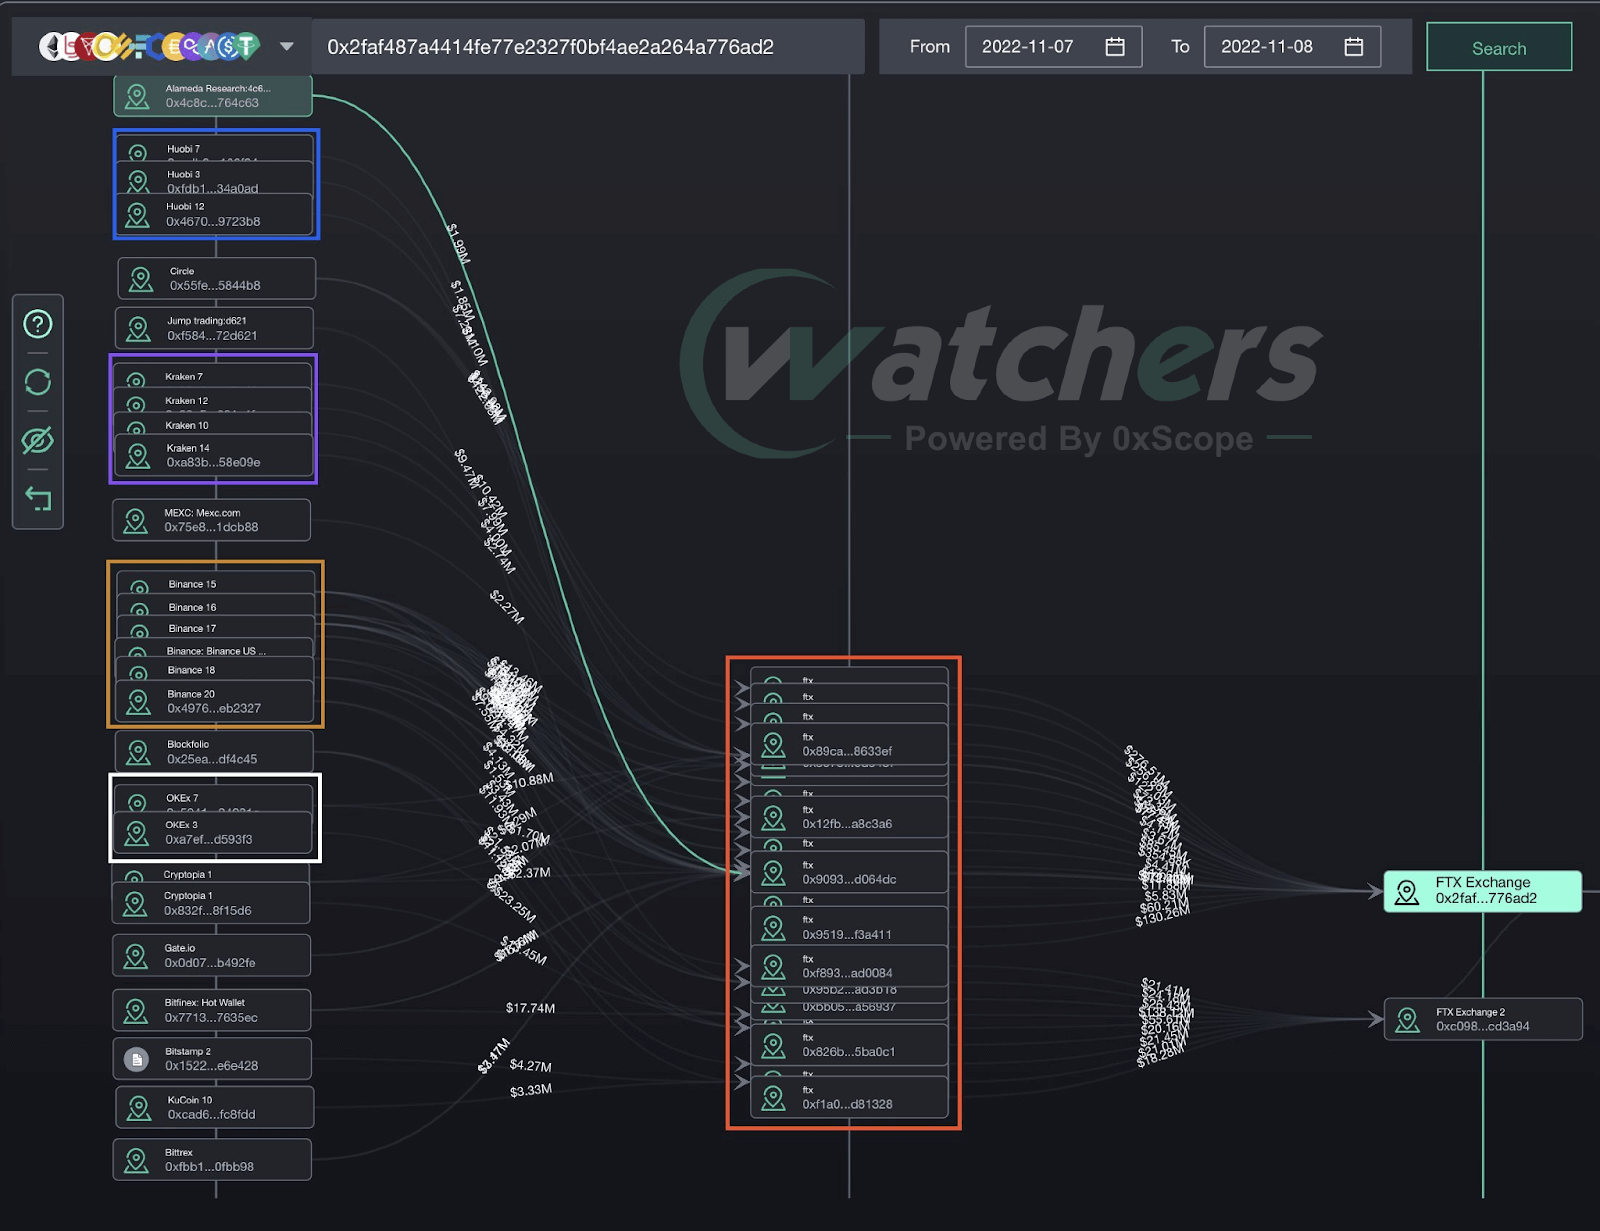
According to 0xScope, most funds to FTX come from other exchanges, especially Binance.
As no retailer would deposit their money at this time, this should be FTX’s own capital, and we haven’t found any cold wallet transfer within two days.
So this signal strongly leads to a possibility that FTX move user’s deposited money to other exchanges for different purpose (Market Making by Alameda) and never have an cold wallet for emergency purpose.
Nov 7th.
Nov 8th.
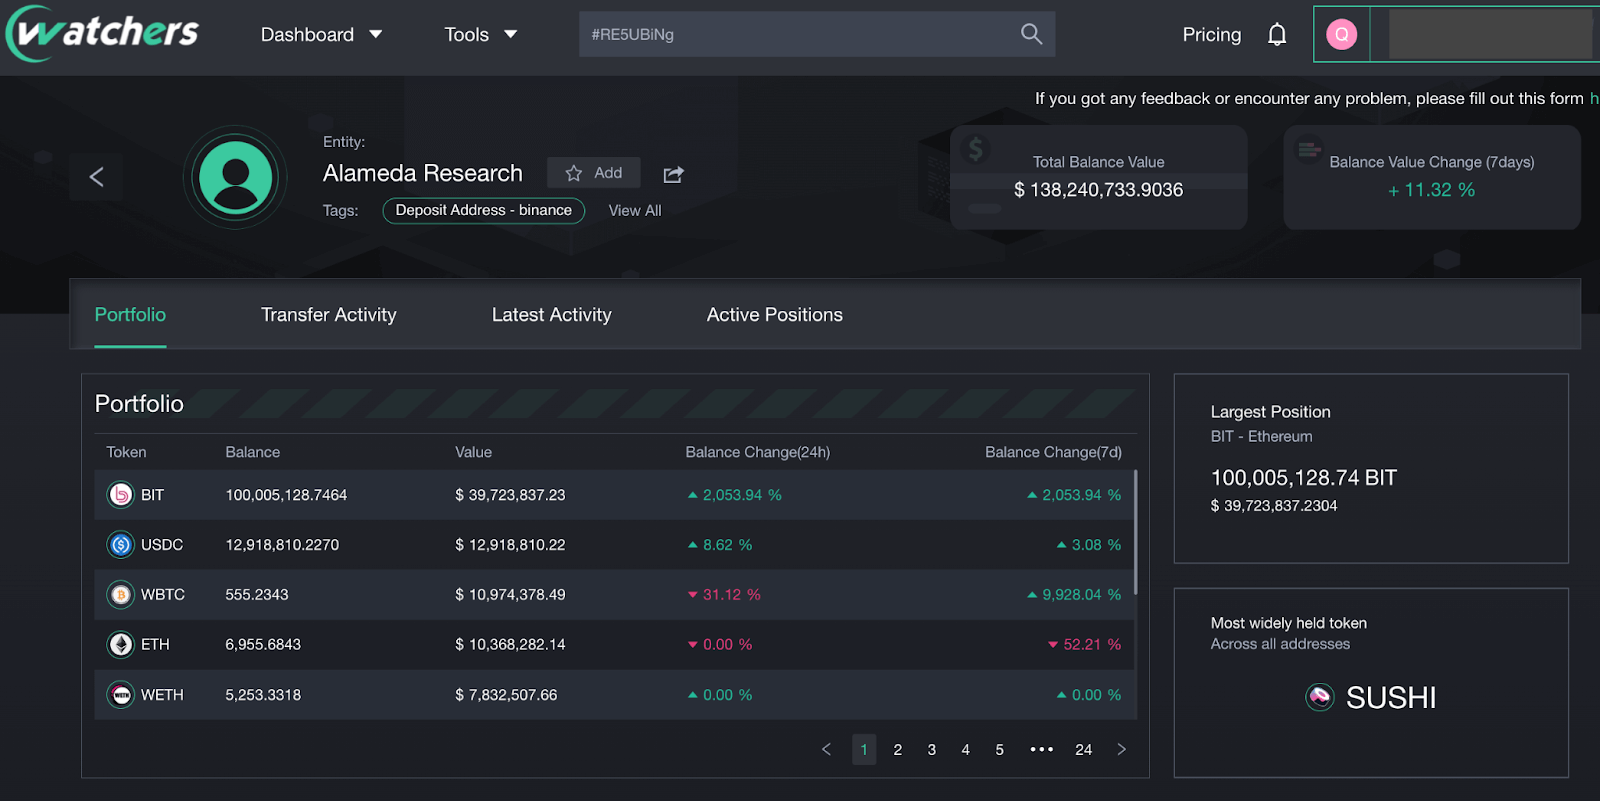
A long-term mix of assets and accounts for both SBF individuals and Alameda also tracked by 0xScope’s entity graph.
As shown in the graph, SBF’s address shares three Binance/FTX deposit addresses with at least 7 other tagged Alameda Research addresses.
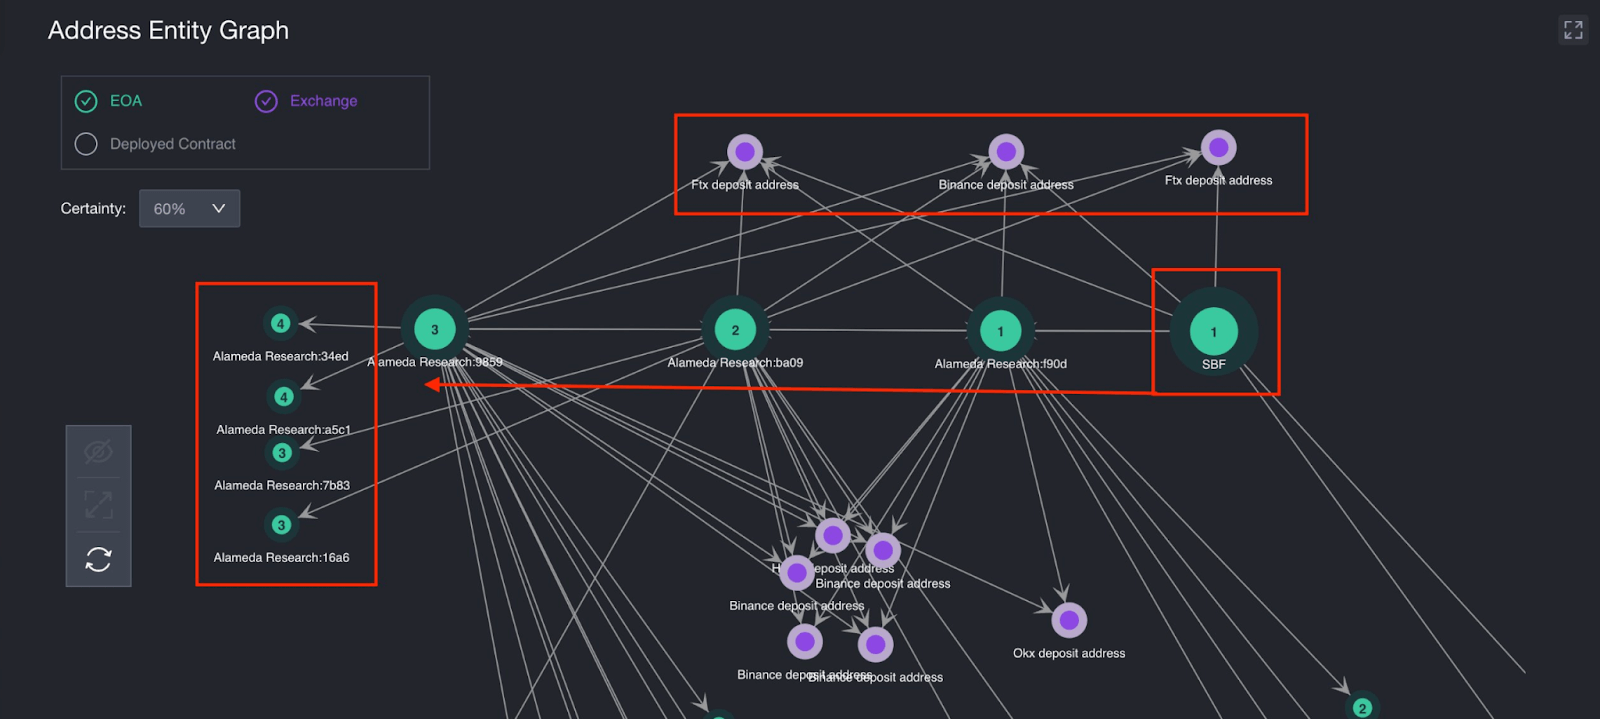
This process can apply to any address; the use case could be finding a connection between a set of selected addresses, and identifying address groups, even sometimes, you can use this tool to find the addresses you already forgot.
This indicates that within Alameda, there is no difference between SBF and the company. SBF controls Alameda’s funds and account to do whatever he wants to.
By monitoring the on-chain data, it is possible to spot early warning signs and keep your funds safe, no matter which CEX or DEX you use. In the case of FTX, several key indicators pointed to a loss of confidence in the platform and insiders scrambling to get funds out.
Use on-chain data to track and keep your assets secure
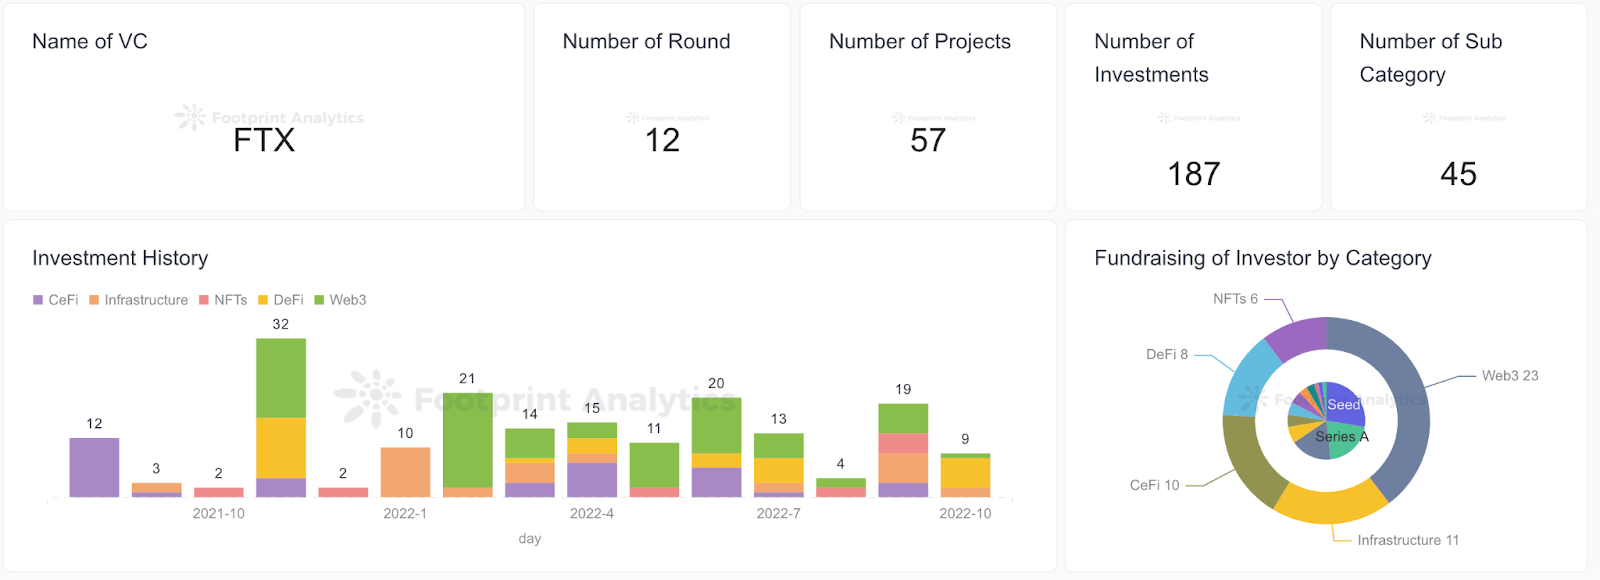
FTX has invested in more than 57 projects in 187 investments. You can check the specific projects in the dashboard below.
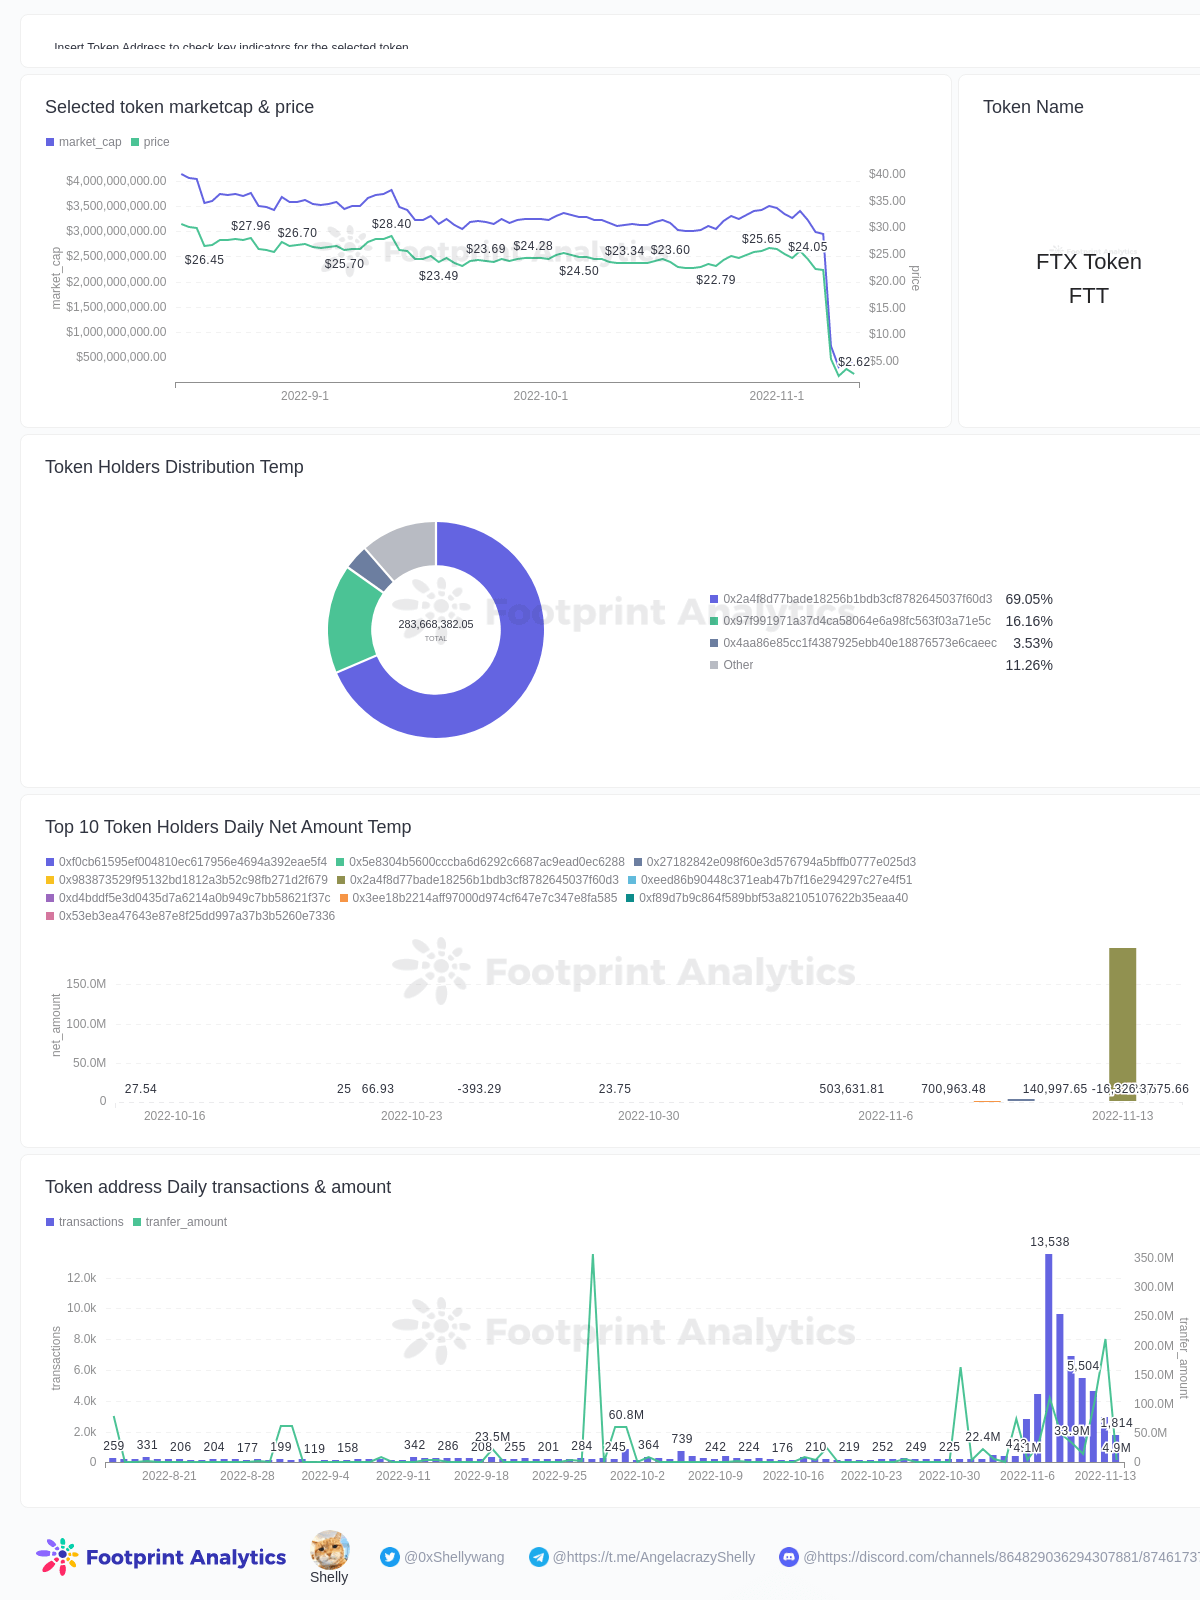
Some critical indicators to monitor your tokens include:
- Marketcap and token price
- Token daily transactions and amount
- Token holder and holding dispersion
- Watch the whale – If there is a token sell-off and the price falls: the token in question may bottom out only after the dispersion stops falling and the big whales stop selling
Monitor funds from other CEX wallet addresses
In a tweet Nov. 9, CZ said all cryptocurrency trading platforms should do Merkle Tree reserve proofing. Banks operate on fractional reserves. Binance will soon start doing proof of reserves, with full transparency. Several exchanges have since published the addresses of their corresponding reserve wallets.
Footprint has built some dashboards according to the announced wallet addresses by FTX and Binance. You can also check the reverses on the addresses announced by different exchanges.
Users can also enter selected addresses to monitor the following changes in the wallet:
- Token balance distribution
- 24H net flow
- Wallet daily net flow and daily balance
And with the upcoming SQL API supported by Footprint, everyone can customize their own wallet trackers on their websites.
Clusters of addresses under the same entity to track related transactions are also available on 0xScope’s Watchers. 0xScope tagged several addresses containing KuCoin, Binance, Gate, OKex, MEXC, Kraken, Huobi, Circle & FTX, Alameda,etc, connecting them with clustering entities to show the whole picture how money flows through different interest parties. Users can also enter customized dashboards to monitor and analyze the unusual fluctuations in the market and set a reminder or alert.
This piece is contributed by Footprint Analytics & 0xScope community in Nov 2022 by Sabrina
Data Source: Footprint Analytics Dashboards
The Footprint Community is a place where data and crypto enthusiasts worldwide help each other understand and gain insights about Web3, the metaverse, DeFi, GameFi, or any other area of the fledgling world of blockchain. Here you'll find active, diverse voices supporting each other and driving the community forward.
0xScope is the first Web3 Knowledge Graph Protocol. It solves the problem that Web3 data analyzes addresses instead of real users by establishing a new identity standard —— the new Scope Entity from the data layer. And it unifies the standards of different types of Web2 data and Web3 data by utilizing its knowledge graphing capability, which greatly reduces the difficulty of data acquisition and improves data penetration ability.
- Footprint Website: https://www.footprint.network
- Discord: https://discord.gg/3HYaR6USM7
- Twitter: https://twitter.com/Footprint_Data
- 0xScope Webiste:https://0xscope.com/
- Discord:https://discord.gg/0xscope
- telegram:https://t.me/Scope_0x
- Twitter: https://twitter.com/ScopeProtocol