 No, Bitcoin isn’t cleared for takeoff after pump to $8,400; here’s why
 No, Bitcoin isn’t cleared for takeoff after pump to $8,400; here’s why

Cover art/illustration via CryptoSlate. Image includes combined content which may include AI-generated content.
While the bullish momentum took a brief pause, Bitcoin continued to tear higher on Jan. 7, breaking past key resistances as if they were butter. The cryptocurrency pumped as high as $8,450 on Jan. 7, seemingly following similar upward surges in the prices of oil and gold, caused by a development in the now-ongoing U.S.-Iran conflict which began late into the first week of 2020.
While this latest move to $8,400 has made many traders flip bullish, claiming that the macro downtrend that brought Bitcoin from $14,000 to $7,000 is decisively over, there are purportedly still a confluence of bearish technical signals that suggest bears may soon assert control over the cryptocurrency market.
Is Bitcoin ready to surge higher?
In the past week, the price of BTC has gained a jaw-dropping 16 percent, marking an amazing start to the new decade.
Despite this, analysts have begun to fear the worse as they have observed that in the low-$8,000s, Bitcoin is approaching a multitude of levels of resistance.
Brave New Coin’s Josh Olszewicz noted that BTC is currently trying to break past a yearly pivot level, the 200-day exponential moving average, and the daily Ichimoku Cloud.
This has been echoed by other analysts, who suggest that Bitcoin is currently trying to break past the downward trend line that has constricted upward price action for some seven months now.

While there’s a chance that BTC will make it through these levels, the odds are stacked against bulls.
The fact that Bitcoin is approaching key resistances has been underscored by technical trends.
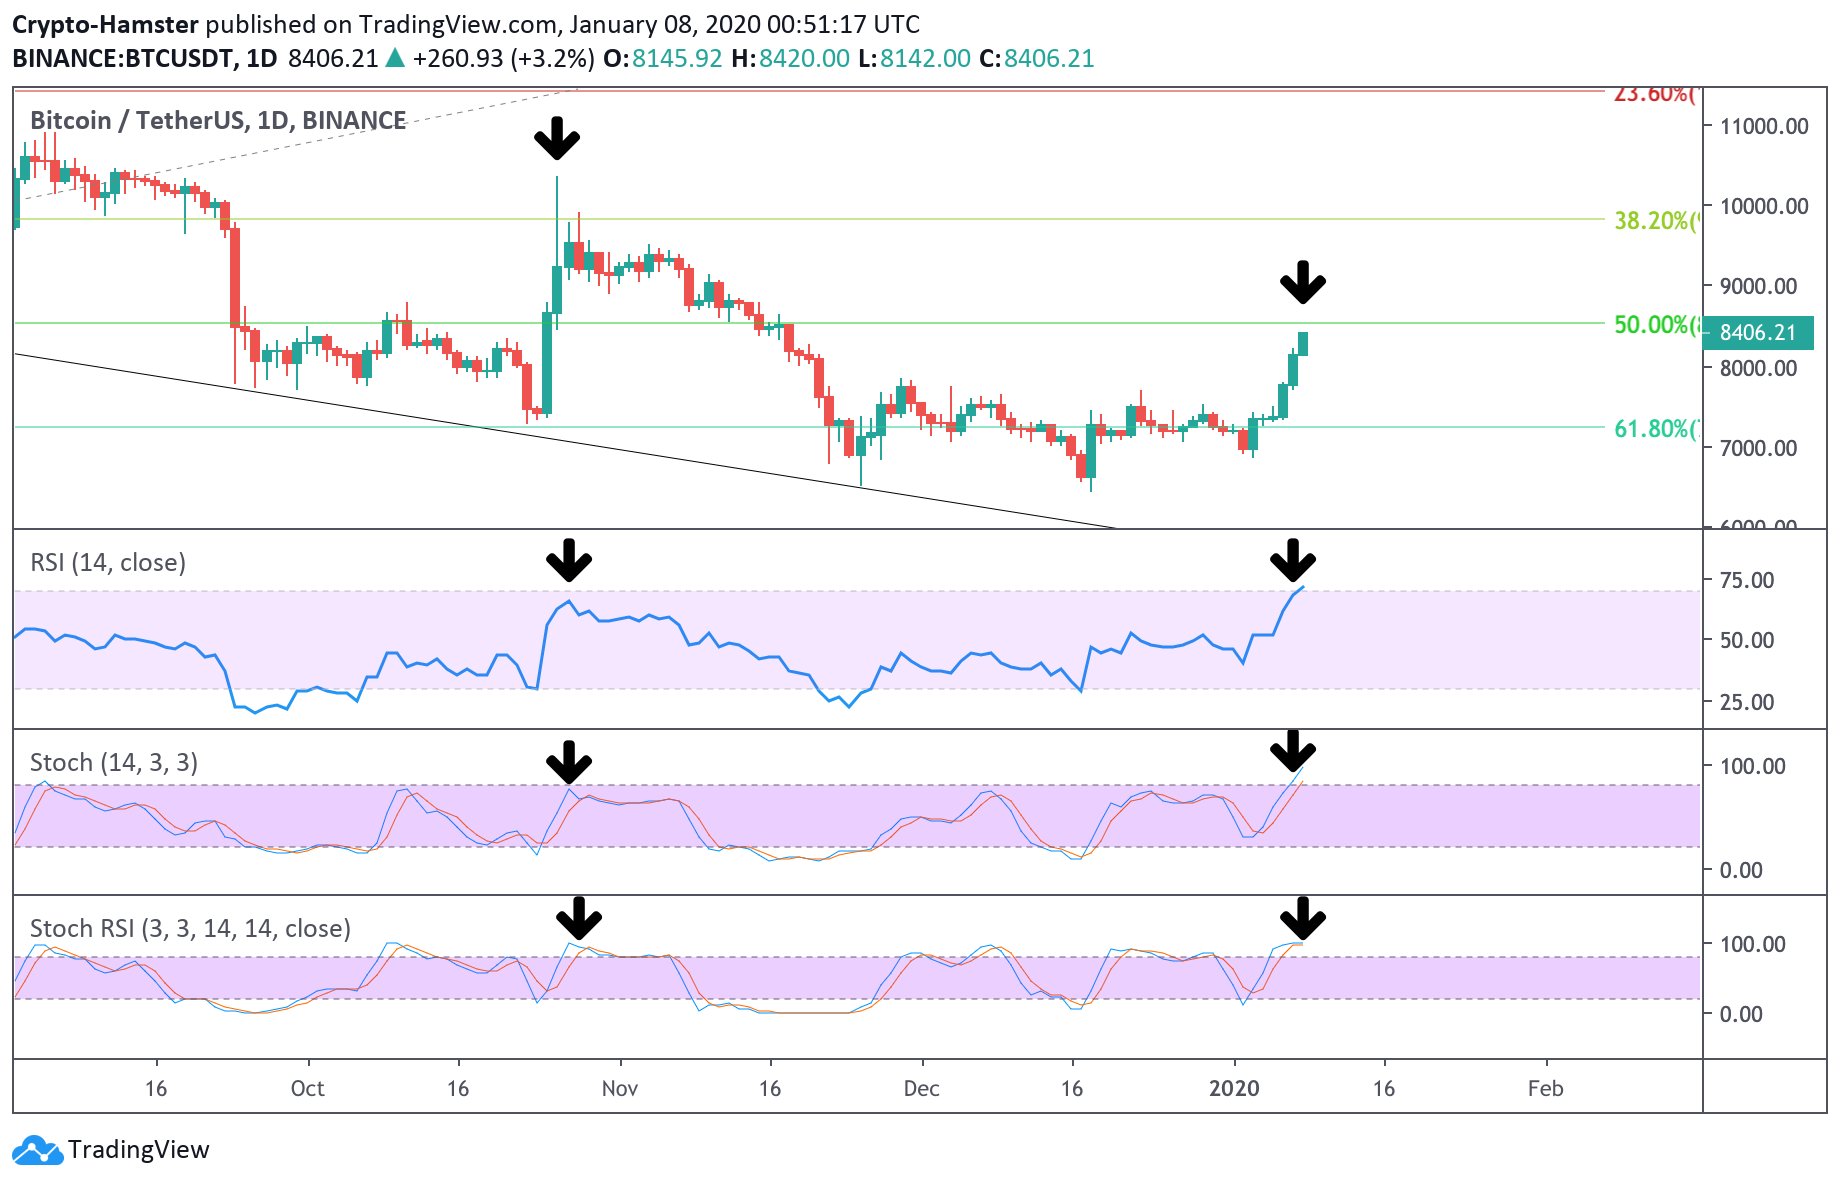
In the wake of the move to $8,400, a cryptocurrency analyst posted the below image, showing that three indicators suggest Bitcoin is dramatically overextended on the bull side of things.

More specifically, the Relative Strength Index, Stochastic Oscillator, and the Stochastic RSI—all three being indicators to track an asset’s directionality—are now printing higher readings than they were after Bitcoin’s pump to $10,600 at the end of October 2019. What followed the aforementioned pump was a dramatic decline that brought BTC lower than it was prior to the jaw-dropping surge. Also, Bitcoin’s chart has printed three bullish candles in a row, a trend that has rarely been seen over the past few months.
The insinuation here is that there’s a relatively low chance that Bitcoin continues to rip higher from $8,400 due to the market likely being well overextended.
A bearish narrative could be deemed moot by Iran-US conflict
While there is a case building for a short-term bearish drop, it may be overridden by a single fundamental factor: the U.S. decision to kill Iranian general Qassem Soleimani has seemingly been a catalyst for the latest rally in three assets: oil, gold, and Bitcoin.
The price of gold is up 6 percent against the U.S. dollar since Soleimani’s death, while Bitcoin is up 23 percent in the same time. Both assets have posted a large portion of their gains when developments regarding the conflict have hit the news.
So should there be developments in the conflict and gold rallies, there’s a high likelihood Bitcoin could shun the abovementioned bearish factors and continue higher.
$BTC up 23% following Soleimani's death
Noisy coincidence, or is #bitcoin maturing into a "digital gold" safe haven asset? pic.twitter.com/YWuTE1OvVN
— The Crypto Dog? (@TheCryptoDog) January 8, 2020
Bitcoin Market Data
At the time of press 2:15 am UTC on Jan. 8, 2020, Bitcoin is ranked #1 by market cap and the price is up 5.94% over the past 24 hours. Bitcoin has a market capitalization of $152.07 billion with a 24-hour trading volume of $29.79 billion. Learn more about Bitcoin ›
Crypto Market Summary
At the time of press 2:15 am UTC on Jan. 8, 2020, the total crypto market is valued at at $220.31 billion with a 24-hour volume of $94.6 billion. Bitcoin dominance is currently at 69.10%. Learn more about the crypto market ›


 Deribit


