Bitcoin’s steady stand: 146 days of trading between $40k and $45k
The current sideways movement in Bitcoin's price mirrors its historical trading behavior.
Quick Take
Bitcoin's price rally from October 2023, which saw it soar from $25,000 to $49,000 in January 2024, witnessed the digital asset hitting the $40,000 mark for the first time since April 2022 on Dec. 4.
From then on, it steadily consolidated above $40,000 for 49 consecutive days. However, it lost the $40,000 support level on Jan. 22. Bitcoin's trading price currently hovers around $42,000.
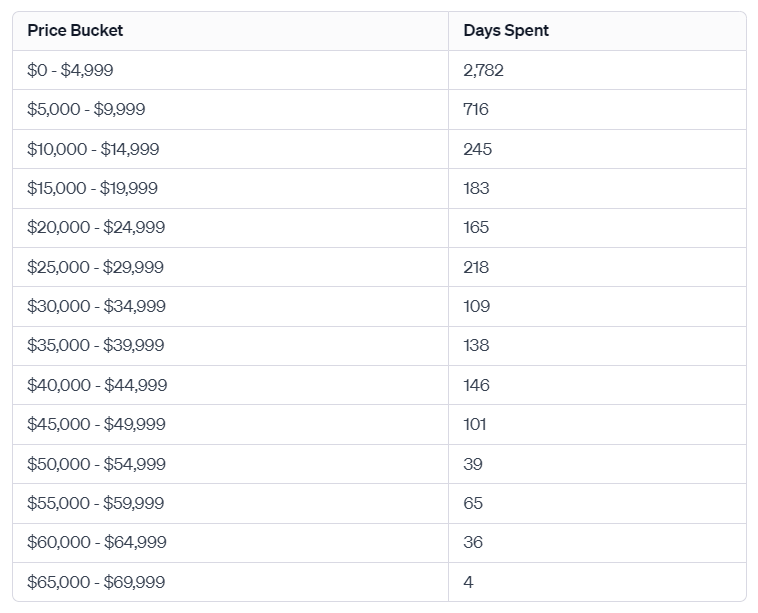
Digging deeper, the price analysis in $5,000 increments reveals a pattern. Bitcoin has been trading within the price range of $40,000 to $44,999 for 146 days. This duration has recently overtaken its previous stint in the $35,000 to $39,999 range, which spanned approximately 138 days.
When assessing price increments from $10,000 and upwards until $49,999, it becomes apparent that Bitcoin typically trades within these ranges for a period between 100 and 250 days. Thus, the current sideways price action aligns with Bitcoin's historical trading patterns and can be considered characteristic behavior, not an anomaly.