Bitcoin’s 10% drop aligns with historical bullish trend patterns
Analysts see Bitcoin's latest setback as an ebb in bull market, with historical trends suggesting Bitcoin's recent 10% decline is a typical.
Quick Take
Bitcoin, as it currently stands, is down approximately 10% from its year-to-date high of around $45,000. This decline is not anomalous with past trends but falls within the expected behavioral patterns of the digital asset in a bull market.
As investor confidence increases, so does the use of leverage, which subsequently leads to a greater number of liquidations. This was exemplified by the largest long liquidation observed in the past three months, coinciding with the 10% retraction in Bitcoin's value.
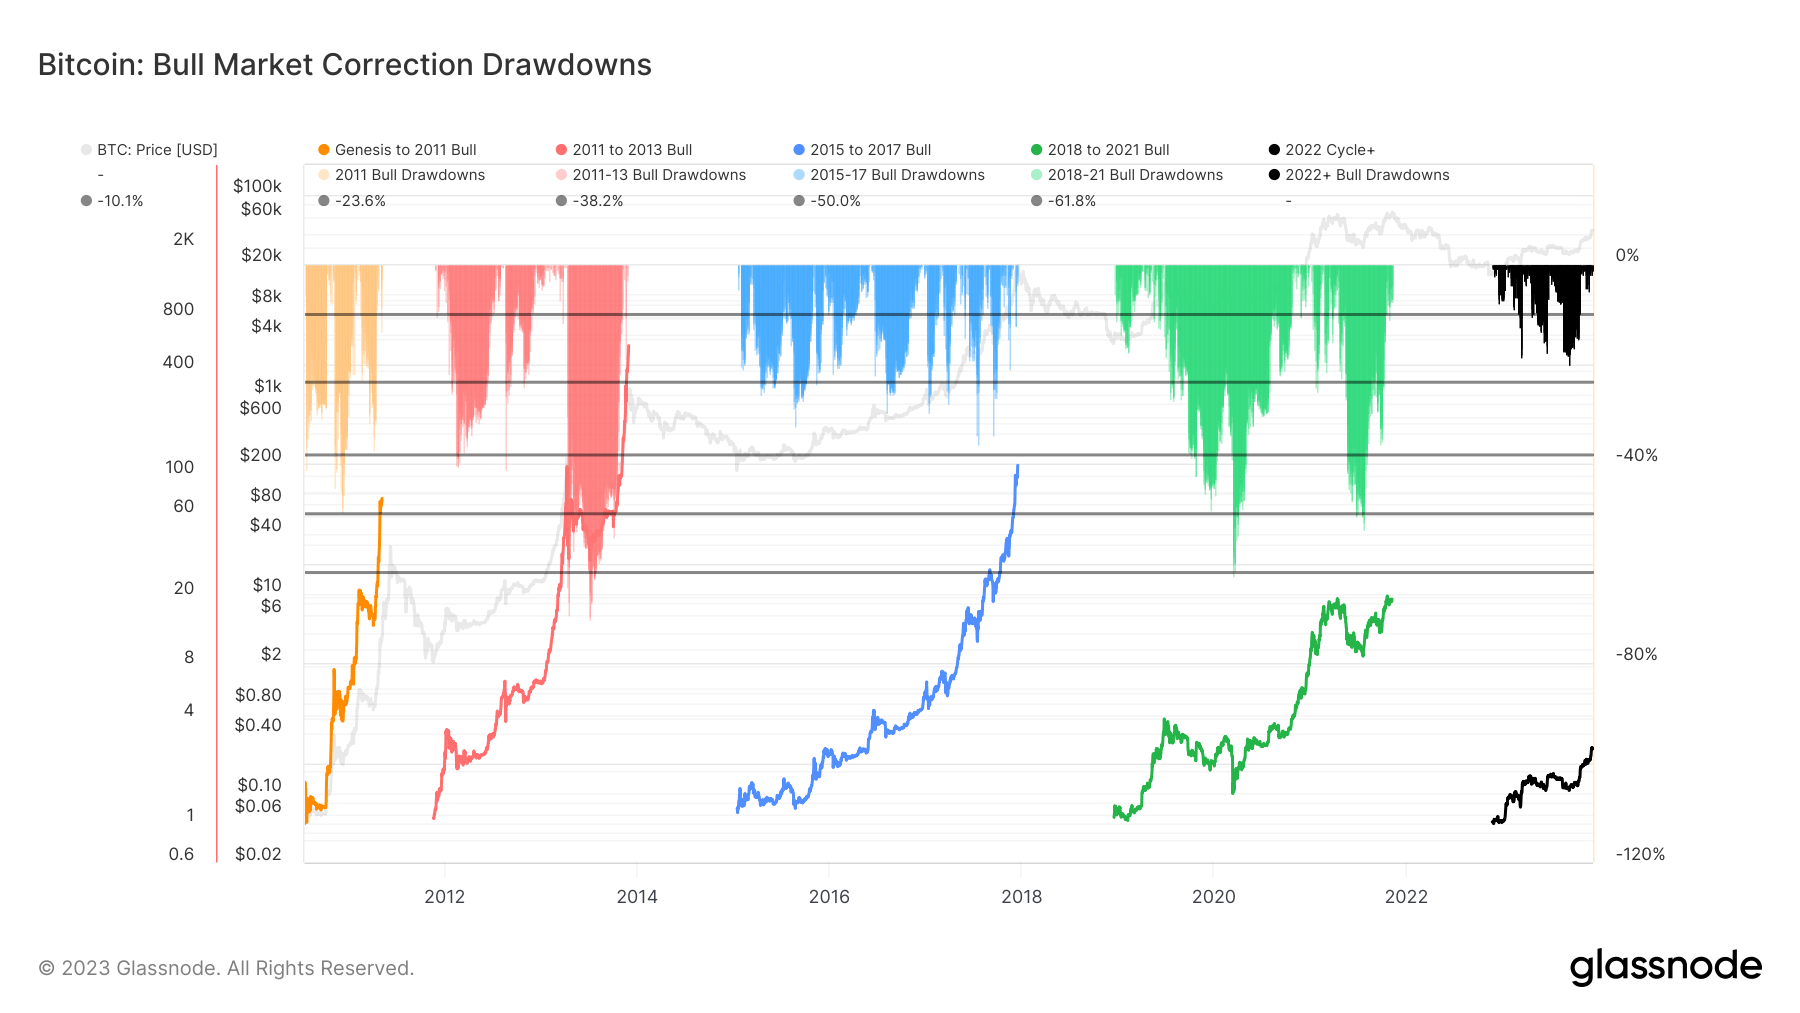
A retrospective glance at previous bull market cycles unveils a recurring pattern. Between 2011 and 2013, drawdowns exceeded 23%. A similar pattern was observed in the periods from 2015 to 2017 and again from 2018 to 2021, excluding the Covid period, with drawdowns consistently exceeding 23% and even peaking at 35%.
In 2023 alone, the most significant drawdown occurred in September, with a drop of approximately 20%. Consequently, these historical patterns suggest that the current 10% dip is a common occurrence in an active bull market rather than a deviation.