Ethereum’s bull run – the blockchain perspective

Photo by San Fermin Pamplona - Navarra on Unsplash
Research by Jesus Rodriguez and Lucas Outumuro of IntoTheBlock
Ethereum has been experiencing a tremendous market momentum with a price increase of over 55 percent in this month. From a valuation standpoint, Ethereum has always been particularly complicated as it influenced not only by the performance of the native cryptocurrency but also all the token running on the Ethereum platform. That same characteristic makes it sometimes difficult to understand the factors influencing price movements.
The recent Ethereum bull run has had marked footprints in the blockchain behavior of the crypto-asset. An analysis of the Ethereum blockchain reveals very interesting patterns that shed some light on the recent positive momentum as well as the current state of Ethereum from a financial standpoint.
As always, it is fascinating to compare some of the data points revealed by the blockchain datasets against traditional technical analysis methods.
A technical analysis view of Ethereum’s price run
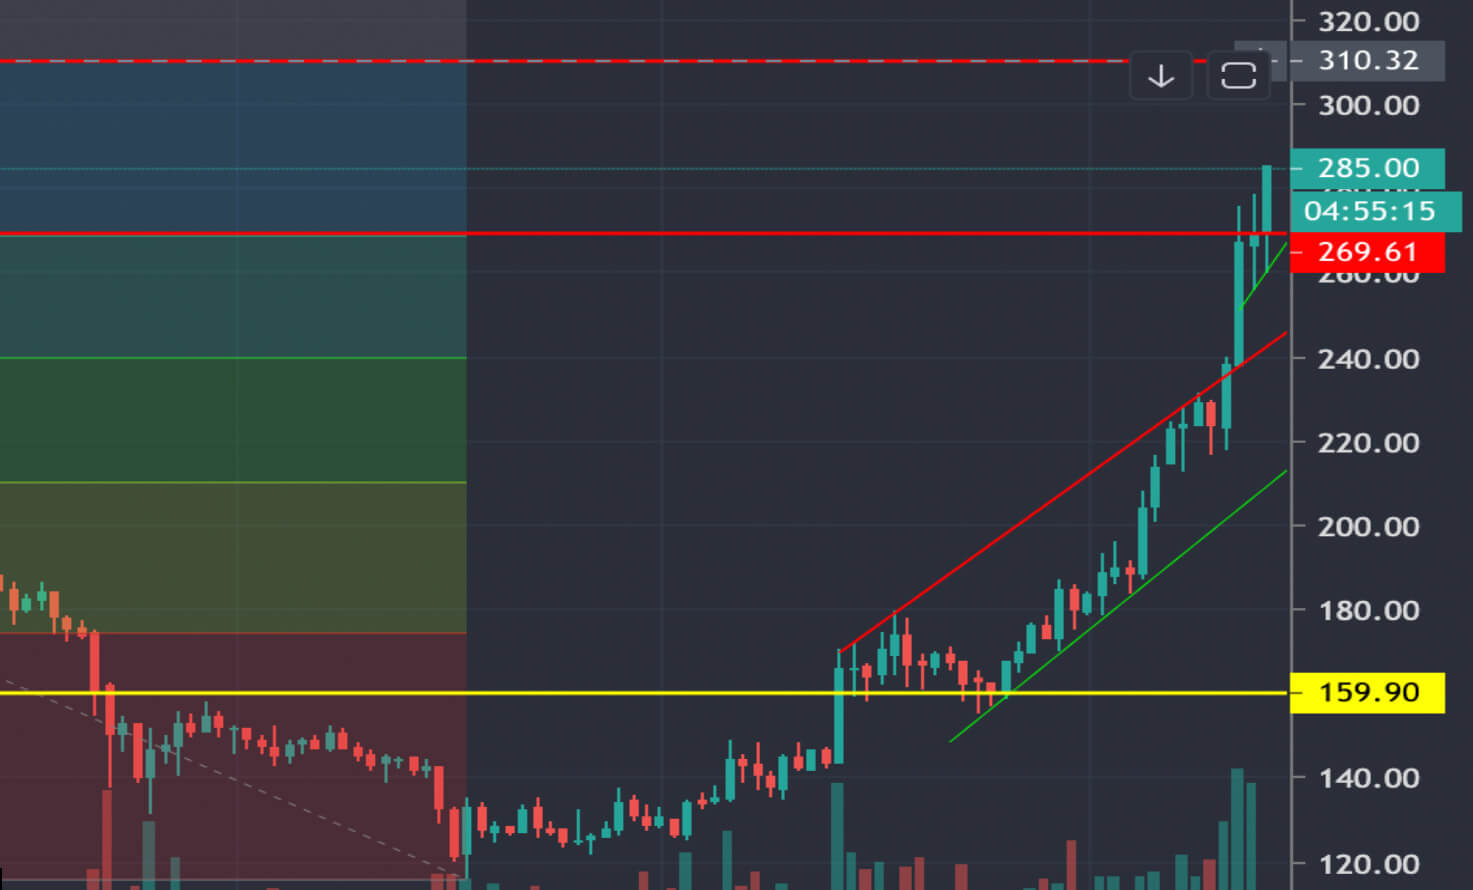
A support-resistance analysis of Ether reveals that the crypto-asset recently broke out from the .618 Fibonacci level at $270. The next area of resistance would be around the $310 level, although there may be selling activity around $300 given that this represents a psychological threshold for most investors.
In terms of support, the recent $270 resistance is expected to turn into a buying area, as well as the trend line of the ascending channel in shorter time frames around $265.
The blockchain perspective
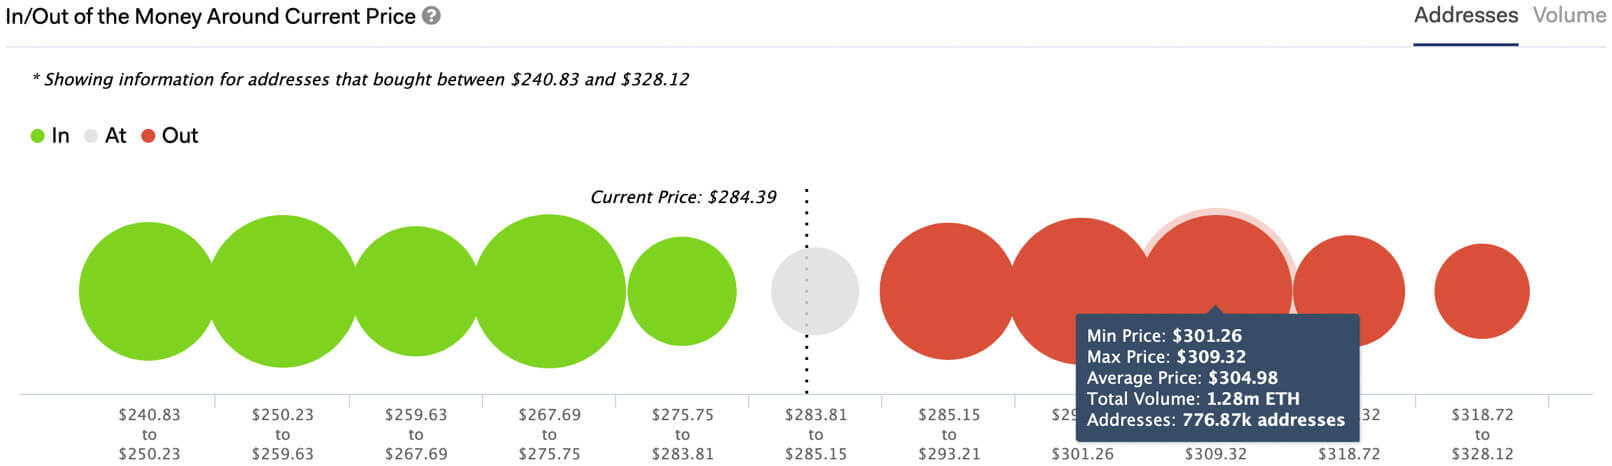
Utilizing statistical and machine learning methods to extract data from the blockchain, IntoTheBlock is able to formulate practical insights about underlying tokens. IntoTheBlock’s In/Out of the Money Around Current Price (IOMAP) uses machine learning to identify the ten most relevant clusters of investor positions at a range of plus-minus 15 percent of the current price. This provides granular analysis of the number of addresses and volume of tokens making or losing money close to the most recent price.
Since the IOMAP indicator quantifies individual holders’ positions, it offers an approximation of the investors that are susceptible to near-term price movements, which can act as a valuable complement to traditional support/resistance levels.
By analyzing the Ethereum blockchain the IOMAP indicator tells us that there are 770,000 addresses that had previously bought between $301 and $309; a large number of addresses that may be looking to sell in this area to break-even on their positions close to the $310 technical resistance.
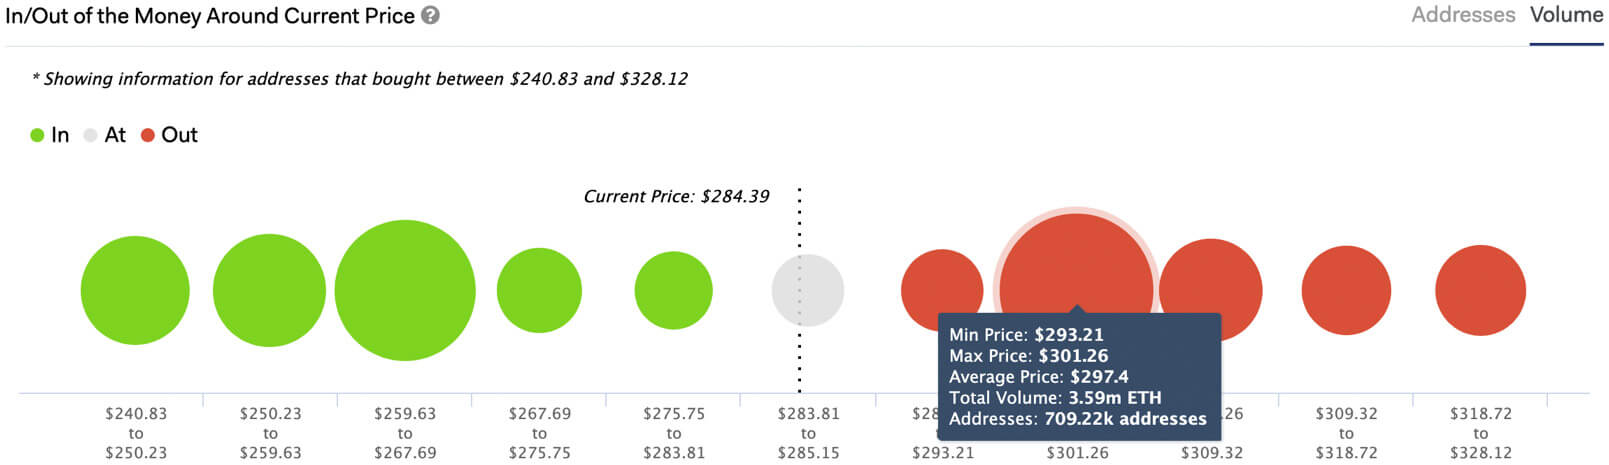
However, sorting the IOMAP by volume suggests that the $300 psychological level may act as a stronger selling area. Looking closely at this indicator, we can see that almost 3.6 million ETH are concentrated in this cluster. While certainly not all of the ETH holders in this area are expected to sell, some of these over 700,000 addresses are likely to, especially after Ether’s remarkable recent price action.
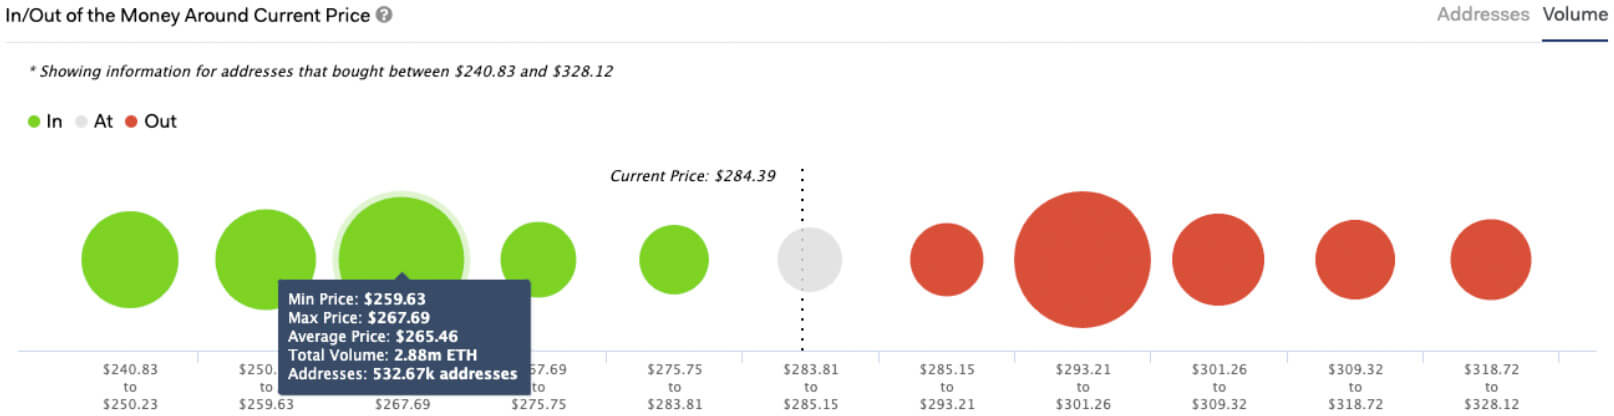
If Ether’s price starts to retrace, however, the buying areas from holders that may be looking to buy in again are not as strong up to the $260-$267 range, where over 500,000 addresses previously bought 2.88 million ETH.
Additionally, by comparing the number of addresses currently making money in their positions to the equivalent at similar price levels, we are able to understand how momentum has shifted throughout that time.
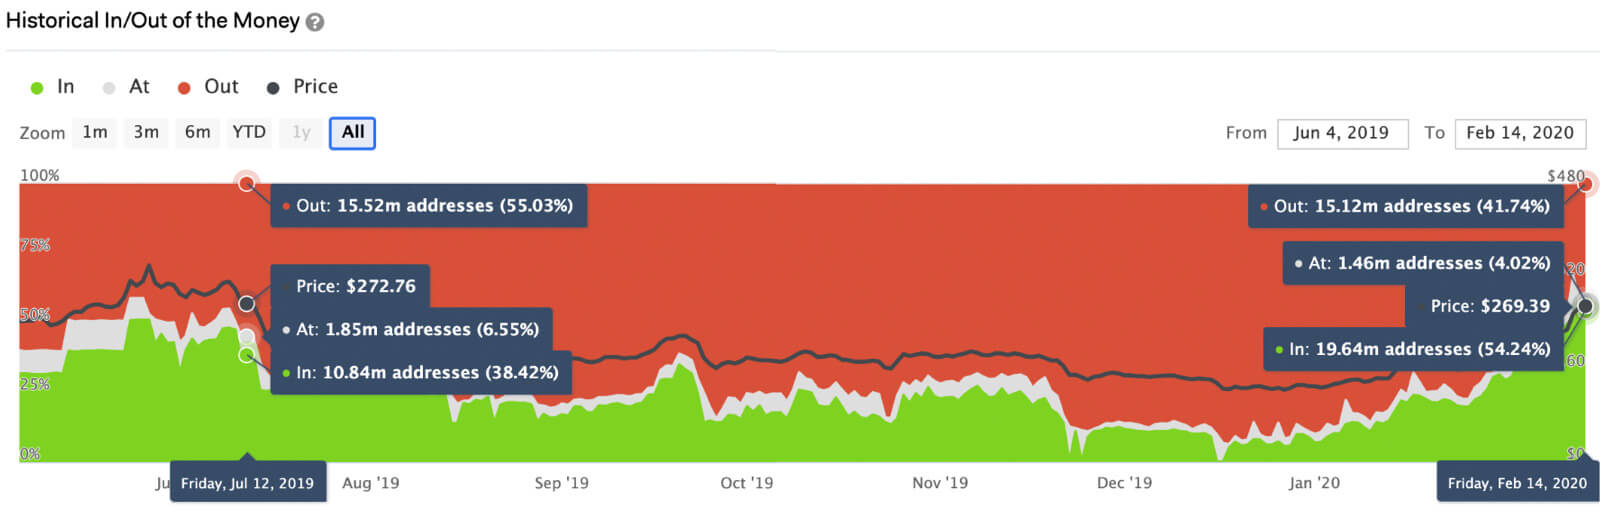
This change in the addresses making money with their positions is displayed in IntoTheBlock’s Historical In/Out of the Money indicator. In Ether’s case, perhaps unsurprisingly, it is the buyers who have the momentum as nearly twice as many addresses are currently making money compared to the last time ETH price was at a similar range.
As can be seen in the graph below, 19.64 million Ether addresses were in the money earlier today, while that number was 10.84 million for a similar price in July 2019. This indicates that a significant amount of investors have been entering the market since last July, shifting the momentum to the bullish side.
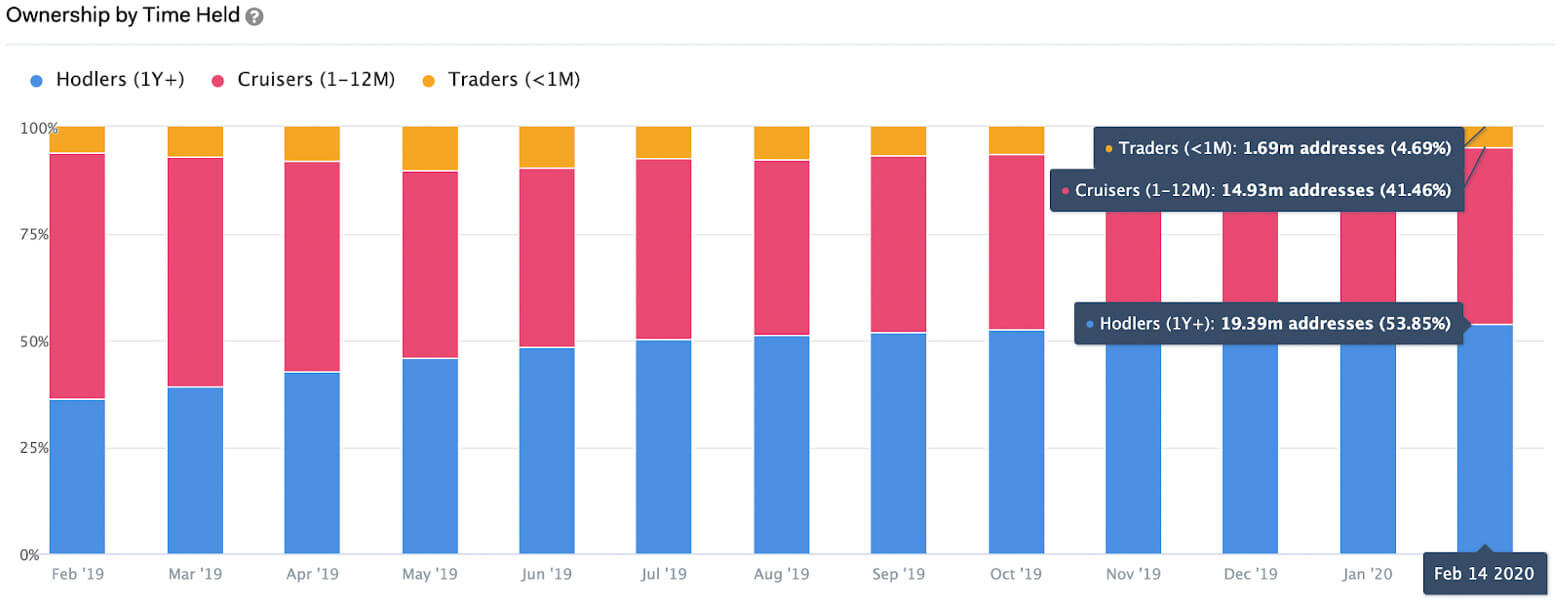
Lastly, IntoTheBlock’s Ownership by Time Held indicator shows that more people have been ‘hodling’ Ether than ever before. The number of addresses holding Ether for over a year has reached an all-time high at 19.39 million, more than double than the 8.4 million last February. This suggests that more investors are looking into Ether as a longer-term investment.
Overall, data stored on the Ethereum blockchain provides an understanding of Ether’s price rise from a different perspective. IntoTheBlock’s indicators suggest an increase in momentum among holders, with almost twice as many addresses making money on their positions compared to half a year ago at a similar price. Having recently surpassed the $270 resistance, the next level expected with large selling pressure is expected to be at $300, where over 3.5 million Ether was previously bought. With more addresses hodling than ever before and momentum on the bullish side, Ethereum is certainly a project to keep an eye out for in 2020.
About the authors
 Jesus Rodriguez is the CEO-CTO of IntoTheBlock, a market intelligence platform for crypto assets. He is a computer scientist, a speaker, and author on topics related to crypto and artificial intelligence.
 Lucas Outumuro is a Sr. Researcher at IntoTheBlock, a market intelligence platform for crypto assets. His areas of focus include crypto derivatives, DeFi and web 3.0 in general.