Data shows Ethereum is becoming more distributed over time as demand rises

Cover art/illustration via CryptoSlate. Image includes combined content which may include the use of AI tools.
A recent report reveals that Ethereum is becoming widely distributed, which could be a direct result of a spike in demand for this cryptocurrency.
Ethereum looks fundamentally strong
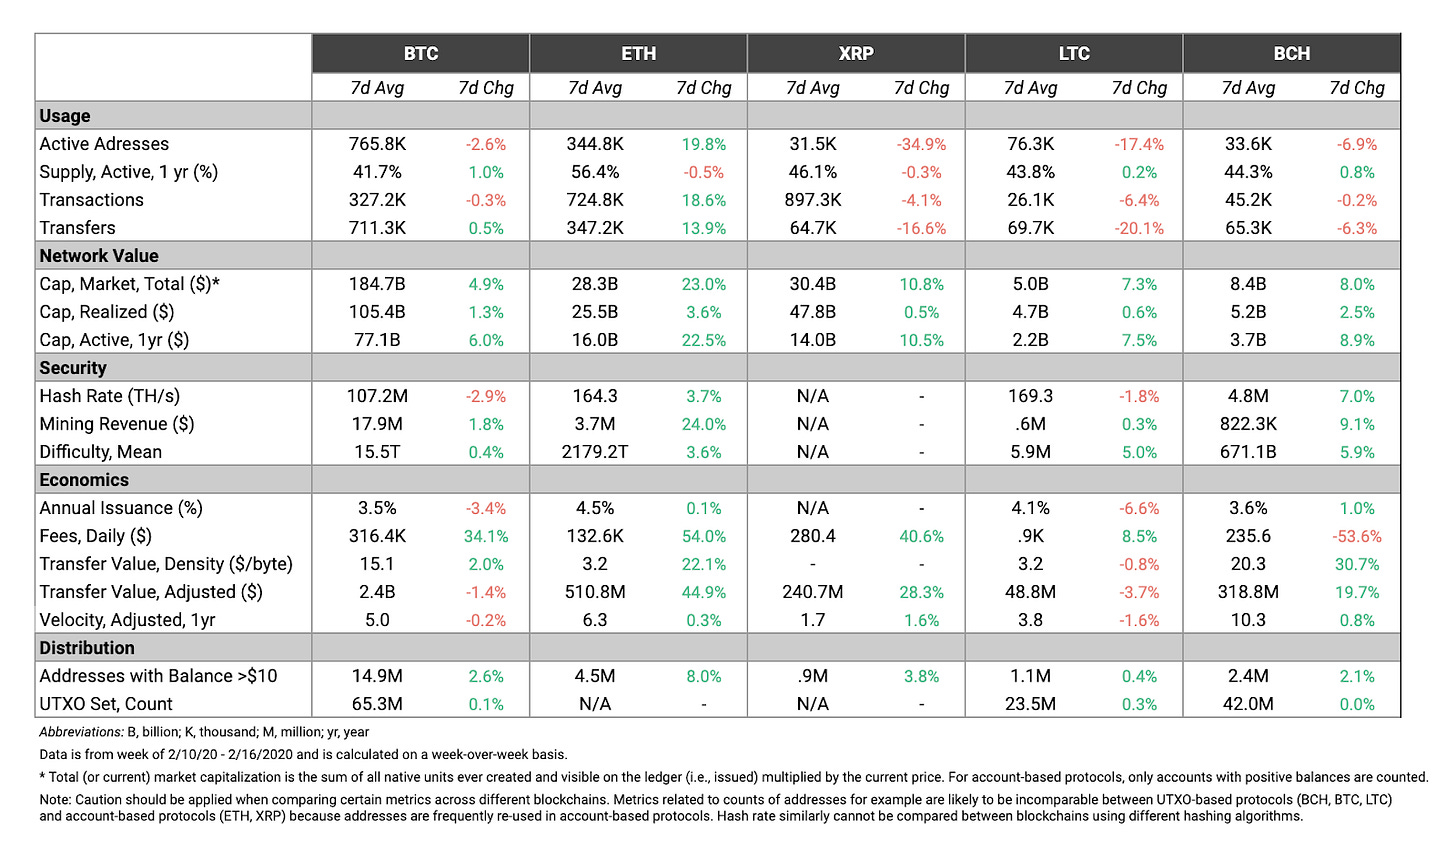
On Feb. 18, Coin Metrics, a crypto market and network analytics provider, released the latest version of its “State of the Network” report. There, the firm highlights that Ethereum is going through a “strong run” as it leads some of the most important technical metrics.
Ether’s realized cap, also known as the average cost basis of all holders of the asset, surged by 3.6 percent over the past week, for instance. A similar behavior can be seen on its hash rate and mining difficulty, which climbed up 3.7 percent and 3.6 percent, respectively. This is a good indicator of the network's health.
Additionally, the crypto analytics firm pointed out that Ether is becoming more distributed over time. A better supply distribution can be perceived as a positive sign showing higher utility and increasing interest among market participants. Although the ETH tokens were initially distributed through a crowdsale, the circulating supply is spreading through more hands.
Coin Metrics affirmed:
“The percentage of supply held by addresses with the largest balances (at least 1/1K of total supply) peaked at about 60% in July 2016. The amount held by these large addresses saw a significant decline as the ICO bubble deflated throughout the end of 2017 and into 2018. As of February 2020, these addresses hold about 40% of total ETH supply.”
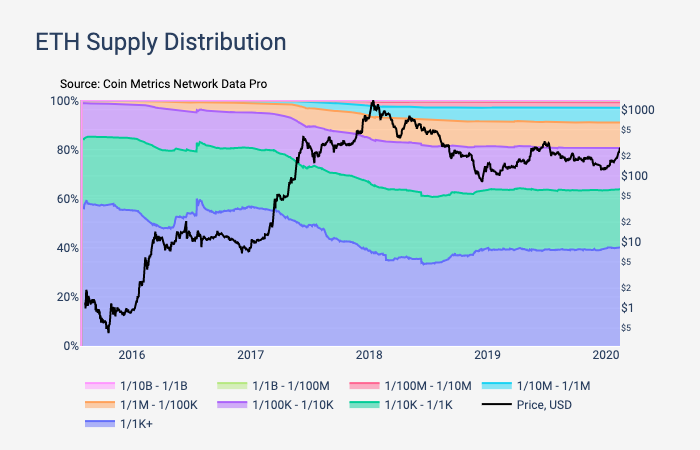
The percentage of supply held by relatively small addresses has been steadily increasing as well. Over the past seven days, addresses with balances over $10 worth of Ether rose by 8 percent, according to Coin Metrics.
Volume is on the rise
The increasing distribution of ETH tokens seems to be related to the fact that “somebody” has been buying a lot of it, explained economist and technical analyst Alex Krüger. Krüger recently noticed that Ether’s trading volume during the past week was four times higher than the average volume throughout the second half of 2019.
One of the most basic economic laws, which is the law of demand, explains that the higher the demand for a particular asset, the higher its price. Therefore, a further increase in interest among market participants in ETH would likely get this cryptocurrency to reach Michaël van de Poppe’s target of $360.
Time will tell whether Ethereum will become better distributed among investors and less centralized, which could certainly catapult its price into higher highs.