Bitcoin Rainbow Chart updated with new lower band after second breach
Predictive price models have come under fire recently, but the Bitcoin Rainbow Chart adds a new lower band to stay "valid."
Cover art/illustration via CryptoSlate. Image includes combined content which may include the use of AI tools.
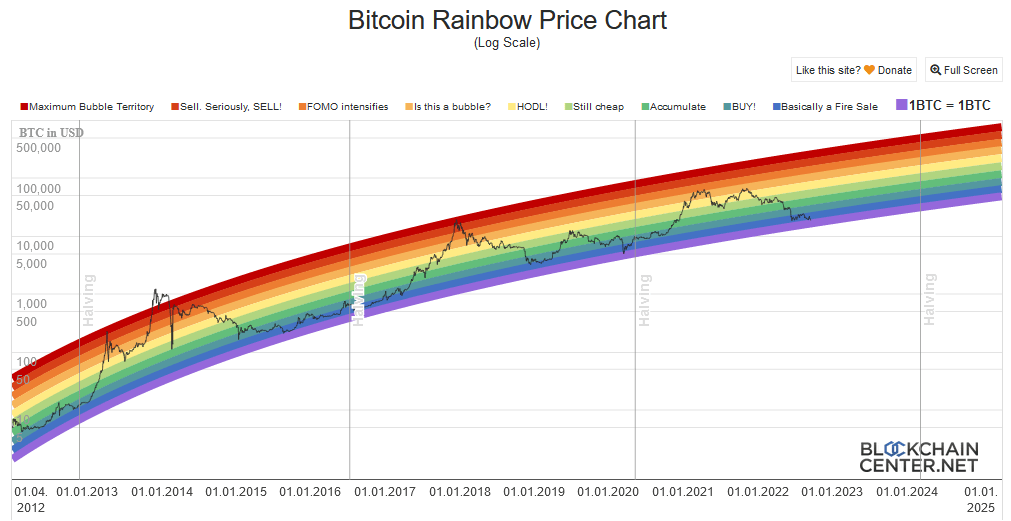
The infamous Bitcoin Rainbow Chart has been updated to include a new lower band called “1BTC = 1BTC.” The chart echoes PlanB's stock-to-flow model in terms of sentiment, with bands indicating when to buy and sell Bitcoin.
“The original Rainbow Chart is dead. Long live the Rainbow Chart with the new indigo color band!”
Twitter account @rohmeo_de commented that the new indigo band “was always missing.” Its inclusion now accounts for the 2020 dip, which saw the Bitcoin price breach the previous lowest band.
In November 2013, BTC breached the upper band before returning within the parameters, only for another upper breach to occur in January 2014.
However, referencing the bearish macro backdrop and invalidation of the Stock-to-Flow predictive price model, @omgbruce mocked the update, implying it was a desperate attempt to stay valid.
Lol!! 😂 rainbow 🌈 chart just updated a lower bound called 1 #btc = 1 #btc 🫣https://t.co/T1hnYlQlGK
— Bruce (@omgbruce) September 19, 2022
The Bitcoin Rainbow Chart
The Bitcoin Rainbow Chart documents the BTC price logarithmically across ten bands, denoting different stages of sentiment. The general idea is that price would move between bands and indicate possible calls to action, such as sell during a red-hot market.
As with all predictive price models, the price should not breach the upper or lower bands. Otherwise, the calculations that derive the bands' positions must be invalid or, at the least, incomplete.
Its creators warn that the chart is not investment advice, past performance does not indicate future results, and the chart is a fun way of looking at long-term price movements.
Before the addition of the new lowest, “1BTC = 1BTC” band, “Basically a Fire Sale” was the previous lowest band.
September 19 sees Bitcoin dip into the new “1BTC = 1BTC” band amid a weekend sell-off that has continued into Monday. At 08:00 UTC, bulls stepped in at $18,200 to stop the slide, sending BTC to $18,800.
Since then, there have been two further retests of $18,800 resistance, with bulls so far unable to break through.
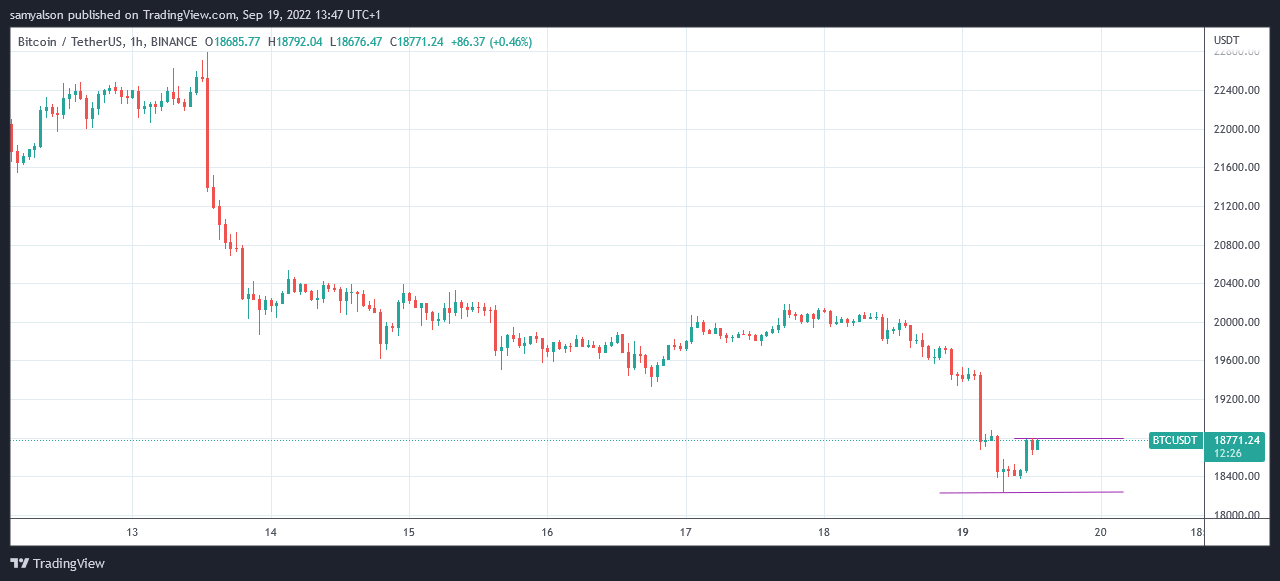
With macro factors weighing heavily on crypto markets, the likelihood of a return back above $20,000 in the near term is low.
The revised Rainbow Chart has a bottom price of around $16,900.
Stock-to-Flow (S2F) gets invalidated
Plan B's S2F model predicts the price of Bitcoin based on the current production rate. It assumes a $100,000 BTC price between now and May 2024.
Despite deviations in the past, the model saw a significant divergence around June, leading to some calling the model invalid, even harmful, due to the false sense of hope price predictive models can give.
In response, Plan B recently took to Twitter, saying he believes S2F is still valid and expects it to snap back in line before the next halving.
People ask if S2F model is still valid. I think it is. We can go technical on autocorrelation & cointegration, but key is IMO that BTC price is not more/less off than in 2011, 2013, 2017. IMO S2F model is valid and I expect a bounce back above S2F model value before 2024 halving. pic.twitter.com/fbjskn5LFH
— PlanB (@100trillionUSD) September 12, 2022