Research: Analysis of on-chain metrics suggests Bitcoin is firmly in capitulation phase
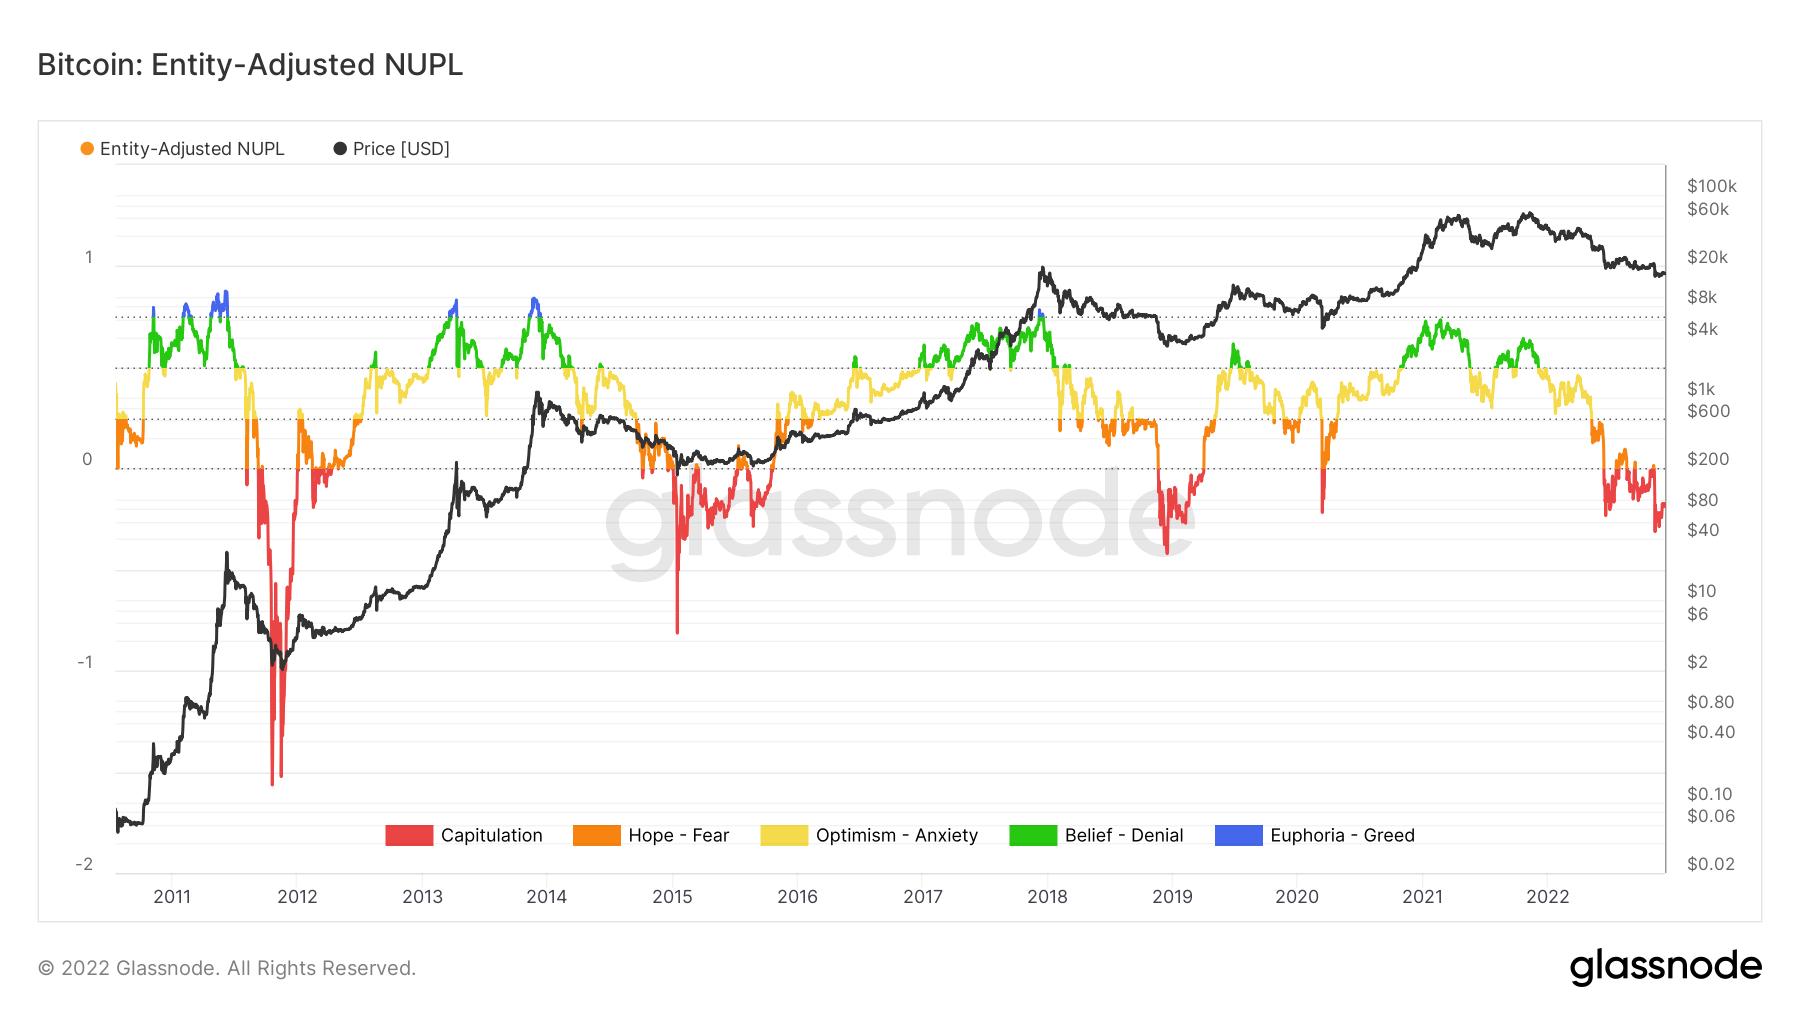
Glassnode data on Bitcoin: Entity-Adjusted NUPL reveals Bitcoin has sunk firmly into capitulation with a market bottom potentially in sight.

Cover art/illustration via CryptoSlate. Image includes combined content which may include the use of AI tools.
Since June, Bitcoin (BTC) – and the general market subsequently – has been in capitulation, other than a handful of rallies seen in the summer of this ongoing bear market according to on-chain data provided by Glassnode, and analyzed by CryptoSlate.
Both bull and bear markets reveal on-chain sentiment data, ranging from ‘Capitulation' to ‘Euphoria – Greed. In the height of a bull market, the top is historically indicated when Euphoria grips tightly. On the other hand, Capitulation usually signals the bottom.
Ongoing capitulation
The chart below shows that BTC has firmly sunk into the Capitulation sentiment as the Net Unrealized Profit/Loss (NUPL) on-chain data displays a descent into red territory seen previous only in 2012, 2015, and 2019.
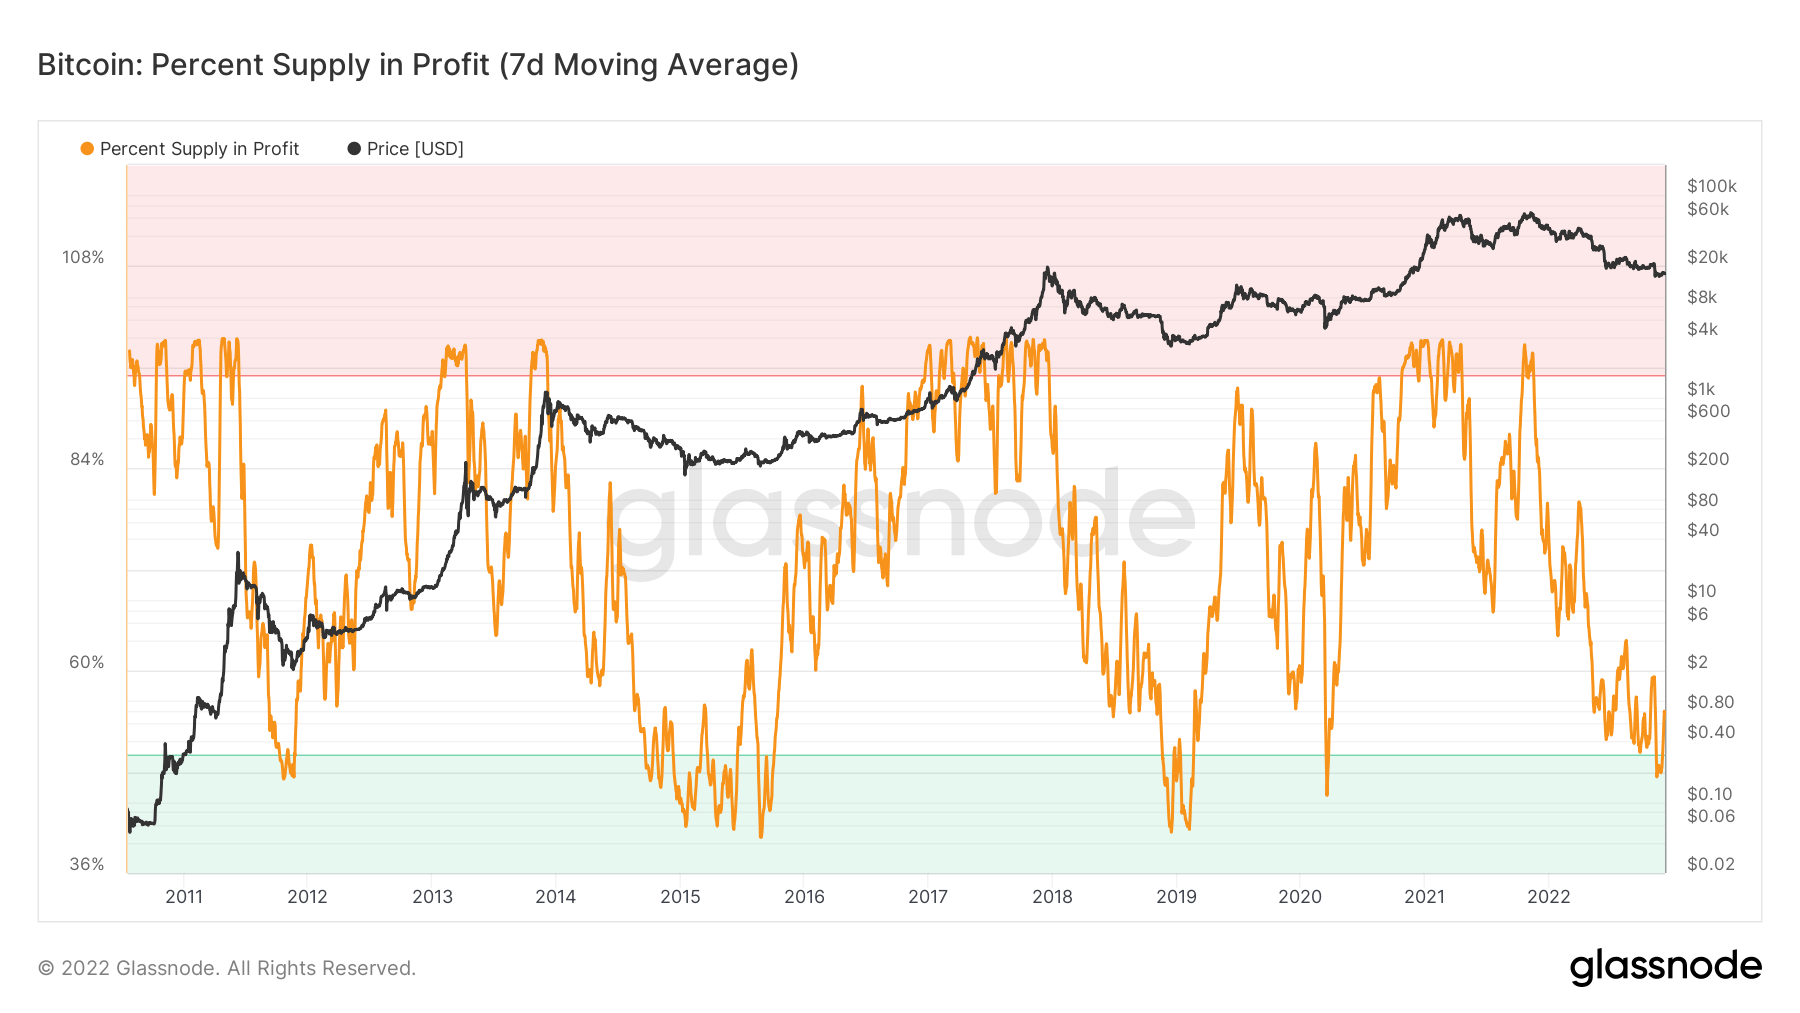
Bitcoin: Decreased circulating supply
The Bitcoin: Percent Supply in Profit (7-day Moving Average) metric shows that currently, only 54% of BTC's circulating supply was last moved on-chain for profit. Through the FTX collapse, this metric depicts BTC circulating supply falling below 50% – a level which has only happened during bear market lows.
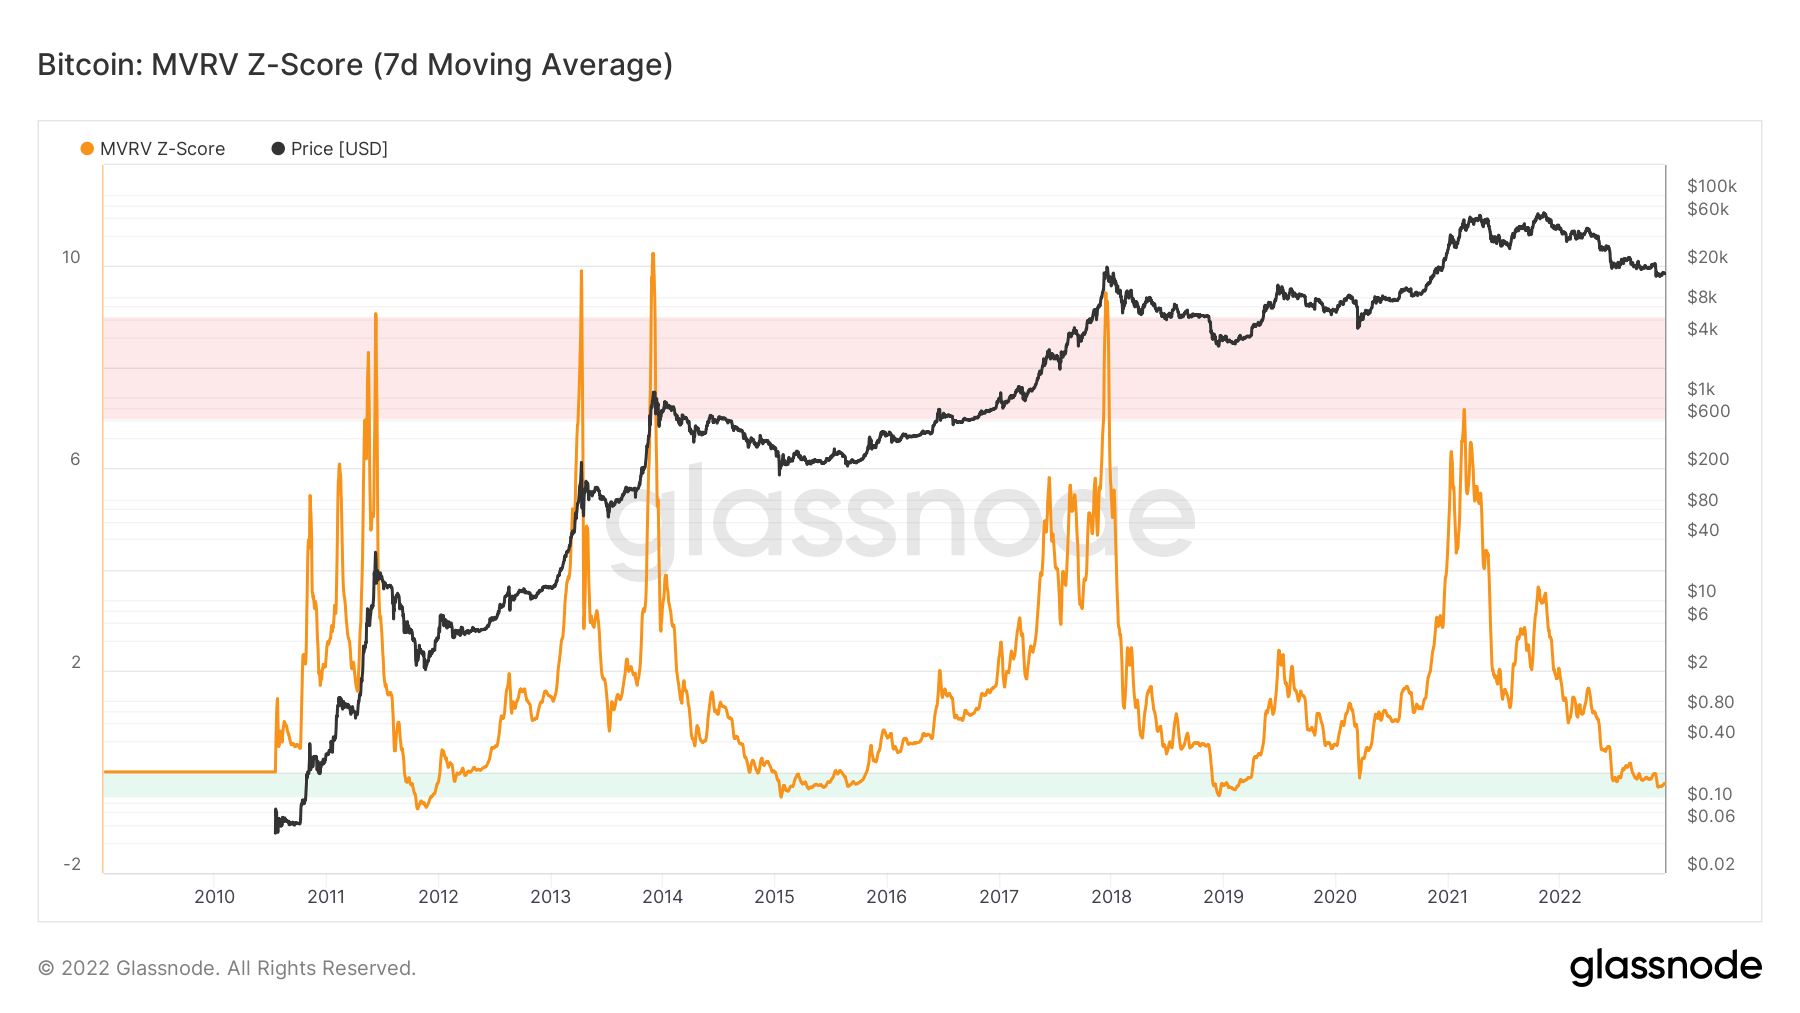
Bitcoin: Over or Undervalued?
Analysis of the MVRV Z-Score (7-day Moving Average) metric reveals that we are already over 170 days below the realized price.
Though Bitcoin did go above the realized price as the result of bear market rallies, historically previous bear market days below the realized price suggest the potential for further capitulation.
Previous Bear Markets:
- 2019-20: 134 days below the realized price
- 2015-16: 384 days below the realized price
- 2011-12: 215 days below the realized price
To summarize all covered metrics in this analysis, the signs of the market bottom analyzed are consistent with other bear market cycles. However, in assessing and comparing this bear market to previous bear markets, we could easily be below the realized price for another six months to a year.
With the addition of geopolitical issues, macro uncertainty, and headwinds, calling a bottom in an unprecedented time such as this can only remain speculation guided by historical data.