 It’s decision time for Bitcoin as it hovers near a critical trendline; levels to watch
 It’s decision time for Bitcoin as it hovers near a critical trendline; levels to watch

Cover art/illustration via CryptoSlate. Image includes combined content which may include AI-generated content.
It’s no secret that 2020 has been a great year for Bitcoin and the entire crypto markets, as the first two weeks of the New Year have allowed BTC to surge from lows of $6,800 to highs of $8,900, while many major altcoins have begun starting parabolic rallies.
This bullishness has slowed today, as Bitcoin is now sitting at a critical long-term trendline, and how it responds to this level in the coming hours and days could set the tone for where it trends in the months ahead.
Bitcoin Inches Lower After Posting Bearish Formation on Its Daily Chart
At the time of writing, Bitcoin is trading down marginally at its current price of $8,750, which marks a slight decline from its daily highs of just over $8,800, which is around where the crypto had been trading at for the past several days and weeks.
It is imperative to note that the latest Bitcoin rally that led it to highs of $8,900 has not resulted in any type of strong rejection, which has led many investors to grow increasingly bullish on the cryptocurrency.
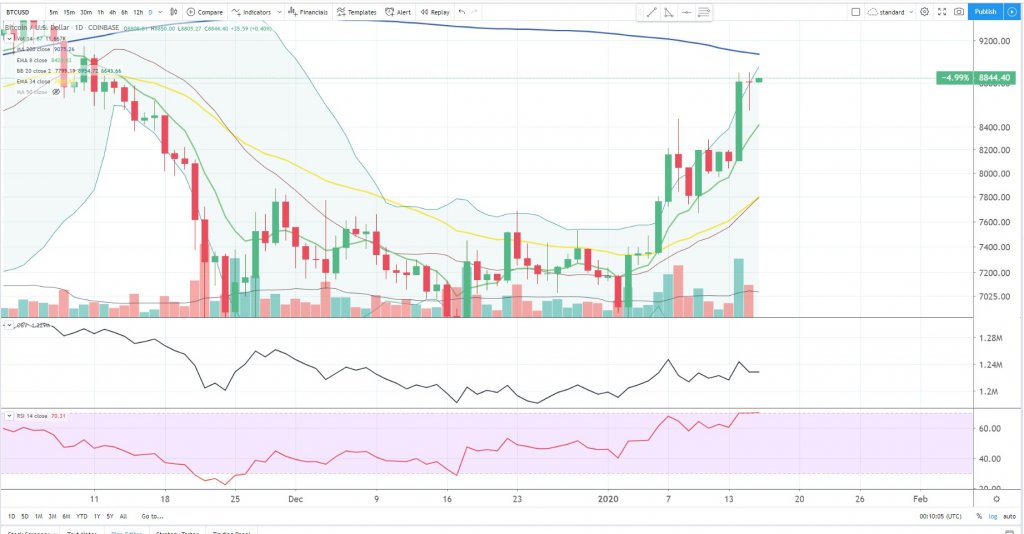
In the near-term BTC does remain in a firm uptrend, although it just posted a bearish tweezer top formation on its daily chart, signaling that the markets could see some near-term downside.
“Bitcoin daily chart – Tweezer top w/ harami cross,” Big Cheds, a popular cryptocurrency analyst on Twitter, explained in a tweet following today’s daily candle close.

BTC’s Reaction to Its Current Levels May Be Critical for Its Mid-Term Trend
The latest rally led many investors to believe that Bitcoin had firmly broken through its bearish trendline, although a recent analysis from cryptocurrency analyst Financial Survivalism seems to suggest that there are a few other factors that should be considered.
Furthermore, he also notes that he believes an ideal realistic scenario for bulls would be to push the crypto towards $9,600 before allowing it to pull back into a bullish golden cross formation.
“Is the BTC bear trendline broken? It’s decision time if you ask me. If just looking at the trendline then looks like yesterday was a clean break. However the parallel channel is a lot closer. I’d love to see another leg up to $9.2 – $9.6K then pull back into a golden cross,” he explained while referencing the collection of charts seen within the below tweet.
Is the $BTC bear trendline broken? It's decision time if you ask me.
If just looking at the trendline then looks like yesterday was a clean break.
However the parallel channel is a lot closer. I'd love to see another leg up to $9.2 – $9.6K then pull back into a golden cross? pic.twitter.com/deOfhNmn3N
— Financial Survivalism (@Sawcruhteez) January 15, 2020
The coming few days will likely elucidate whether bulls will be able to maintain control over the cryptocurrency, as a sustained downwards movement as a result of the newly formed tweezer top could mean a deeper drawback is inbound.


 Deribit


