Research: Ethereum price volatility expected post-Merge as open interest options soar with bearish divergence
Options traders are bracing for volatility post-Merge with the expectation of downside risk to follow.

Cover art/illustration via CryptoSlate. Image includes combined content which may include the use of AI tools.
The eagerly anticipated Ethereum Merge is expected to occur on Sept. 15. This will consolidate the existing Proof-of-Work (PoW) execution layer to the concurrently running Proof-of-Stake (PoS) Beacon chain. Proponents expect this to bring scaling and environmental benefits.
Although the run-up to the Merge has seen a significant jump in price, growing 90% since bottoming on June 18, buying activity appeared to have peaked over the weekend.
Analysis of ETH derivatives metrics showed traders expect a price dip to occur post-Merge.
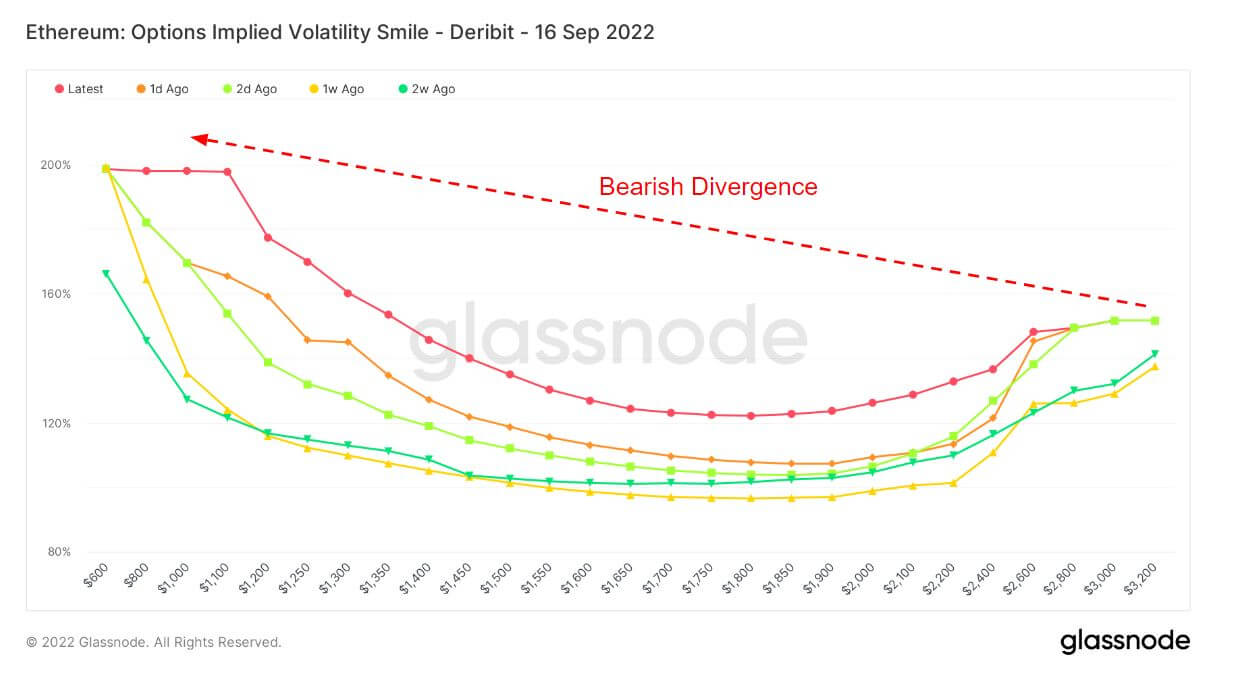
The Volatility Smile
The Volatility Smile chart shows implied volatility by plotting options' strike price with the same underlying asset and expiration date. Implied volatility rises when the underlying asset of an option is further out-of-the-money (OTM), or in-the-money (ITM), compared to at-the-money (ATM).
Options further OTM usually have higher implied volatilities; hence Volatility Smile charts typically show a “smile” shape. The steepness and shape of this smile can be used to assess the relative expensiveness of options and gauge what kind of tail risks the market is pricing in.
The accompanying legend refers to historical overlays and shows the shape of the smile 1 day, 2 days, 1 week, and 2 weeks ago, respectively. For example, when ATM implied volatility values for extreme strikes are lower today compared to historical overlays, it could indicate a reduced tail risk being priced in by the market. In such cases, the market's view has a lower probability for extreme moves compared to medium moves.
Previous research from a month ago examined the behavior of options traders using the Smile Volatility chart. The overall conclusion was that options traders expect a price run-up, leading into a dump post-Merge. But has anything changed between then and now?
The Volatility Smile chart below shows a bearish divergence for each of the historical overlays and the current smile. Typically, at lower strike prices, the implied volatility is lower. But the left tail in each instance is at around 100% or more, signaling the potential for swings in implied volatility post-Merge.
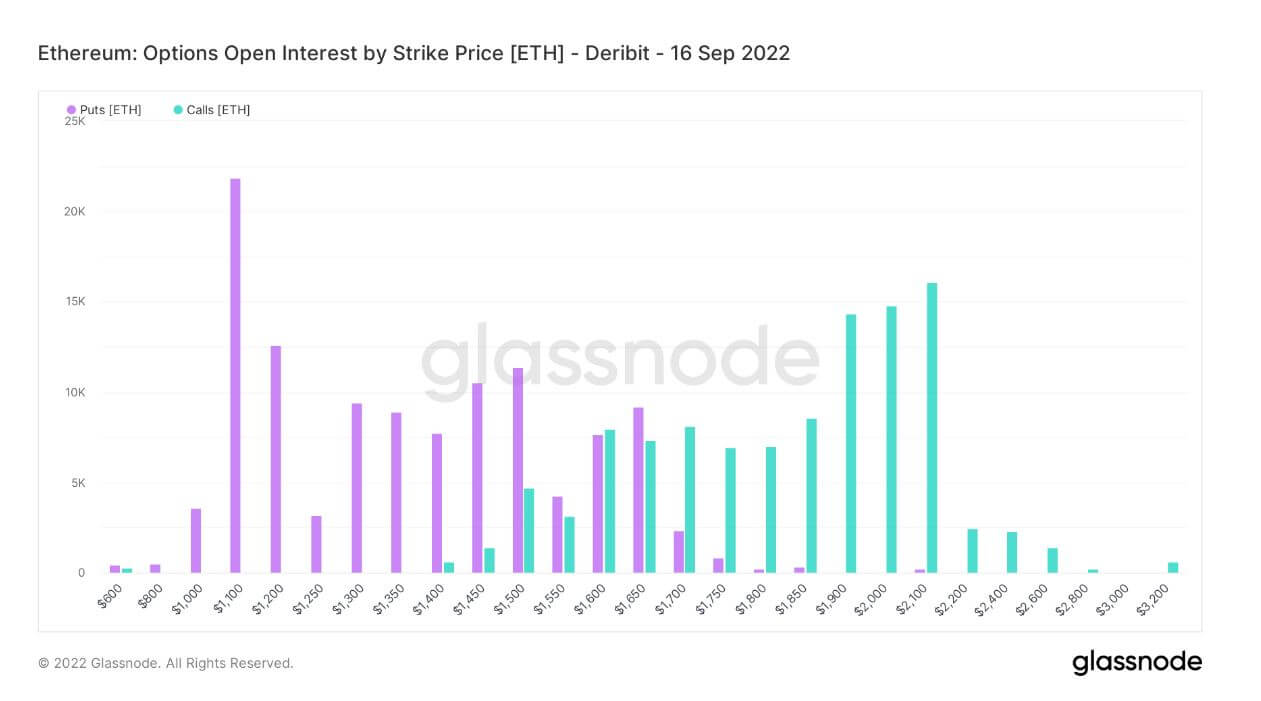
Options Open Interest
Options Open Interest refers to the number of active options contracts. These are contracts that have been traded but not yet liquidated by an offsetting trade or assignment.
There is no information on when the options were bought or sold. However, this metric can be used to gauge volume at various strike prices and determine liquidity.
The chart below shows the total Open Interest of puts and calls by strike price. A slight bias towards puts (or the right to sell a contract) indicates a bearish sentiment. At the same time, the most significant data point shows over 22,000 puts at a price of $1,100.
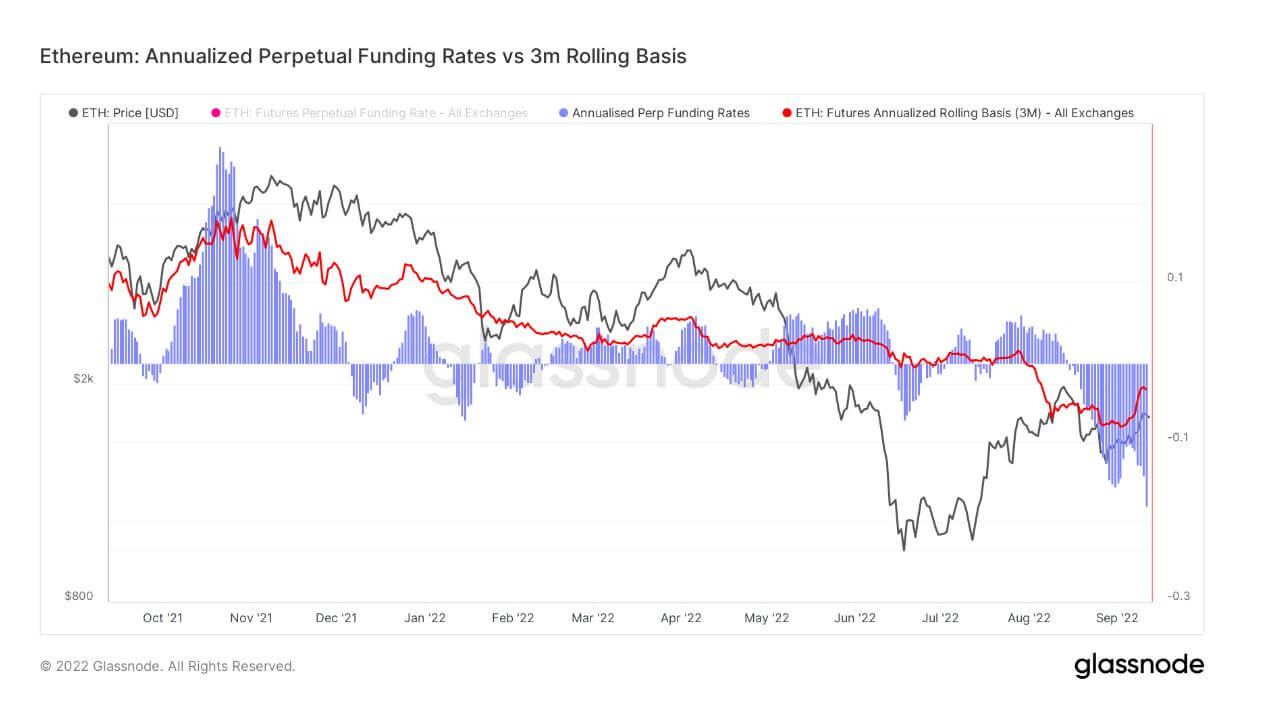
Annualized perpetual funding
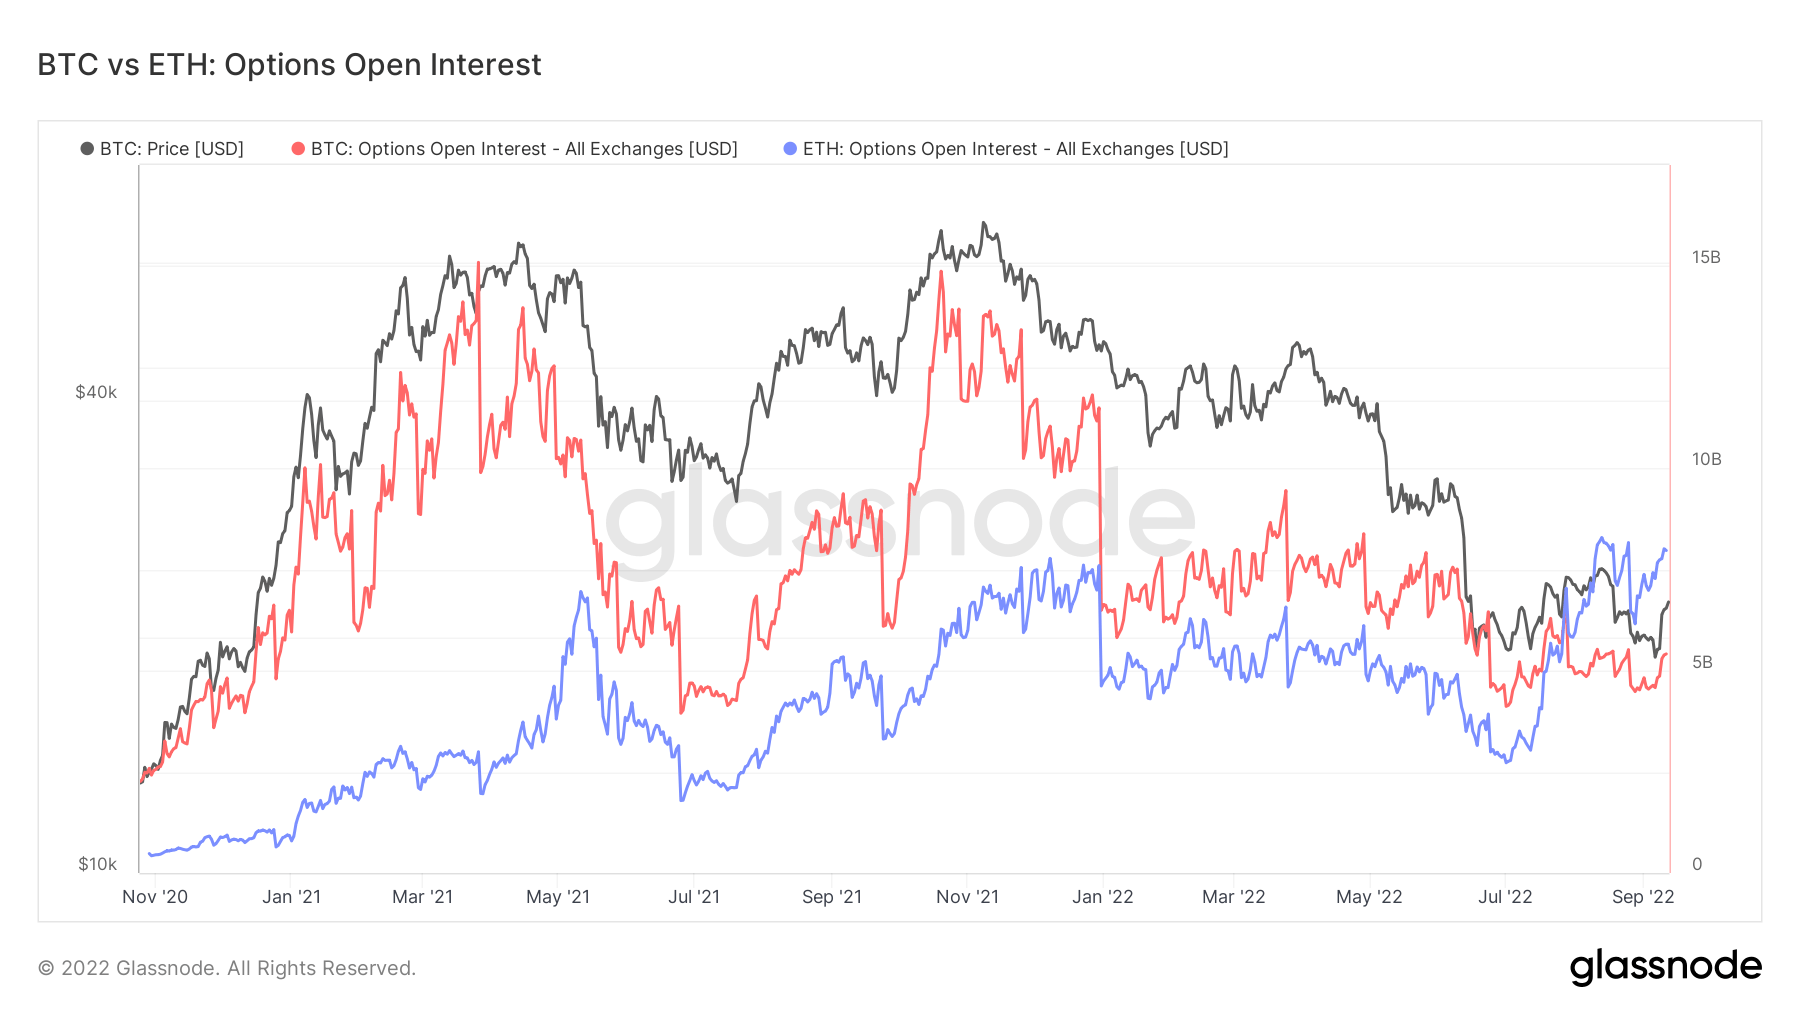
Bitcoin vs. Ethereum Options Open Interest
Comparing the Bitcoin and Ethereum Options Open Interest shows ETH is $8 billion – a new all-time high. Meanwhile, BTC's current open interest is around $5 billion, which is well below its $15 billion peak.
In July, ETH open interest moved BTC for the first time, indicating speculative interest is strong and that derivatives traders are gearing up for the Merge.