Bitcoin’s post-halving price action is mirroring that seen in 2016; What this means for BTC

Cover art/illustration via CryptoSlate. Image includes combined content which may include the use of AI tools.
Bitcoin’s recent mining rewards halving event was long looked upon as a catalyst for the cryptocurrency to see further strength – from both a fundamental and technical perspective.
In the months following this event taking place, however, Bitcoin’s price has stagnated, with bulls and bears both reaching an impasse as it trades sideways between $9,000 and $10,000.
Although the cryptocurrency is currently seeing historically low volatility levels despite the recent adjustment to its block rewards, this isn’t unprecedented.
Data shows that a similar trend took place following the 2016 halving, and it took nearly a year before the benchmark cryptocurrency was able to embark on an intense uptrend.
Bitcoin consolidates following May’s halving, mirrors 2016’s trend
Since the start of May, Bitcoin has been caught within a broad and unrelenting trading range between $9,000 and $10,000.
It has been unable to surmount either of these levels and has been trading between them over the past ten weeks.
There have been a few occasions in which buyers or sellers surmounted the upper or lower boundaries of this trading range, but each move out of this channel has been fleeting.
Despite not seeing the immediate bullishness that many analysts predicted the halving would generate for the cryptocurrency, the recent event could still help create a tailwind that lifts BTC higher.
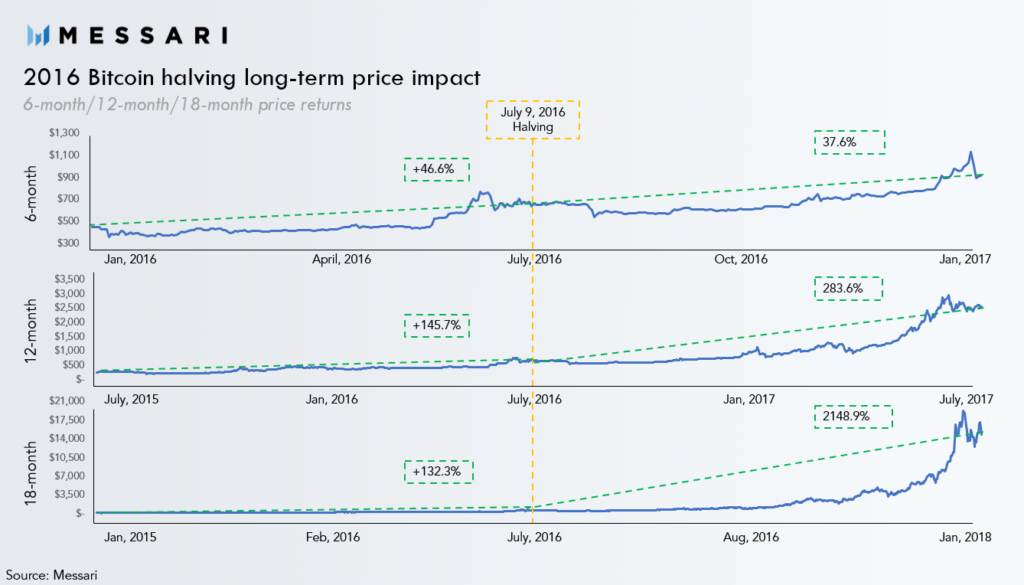
Data shows that after the 2016 halving, the benchmark digital asset saw a prolonged consolidation bout – similar to that seen currently.
This sideways trading ultimately evolved into a slight uptrend that allowed the cryptocurrency to end the year up nearly 40 percent from where it traded at following the halving.
BTC only gained momentum from here, which eventually transformed into the parabolic uptrend that led it to highs of $20,000 the following year.
Jack Purdy, a researcher at Messari, spoke about this in a recent post, offering a chart showing where the halving took place in 2016 relative to Bitcoin’s subsequent price action.
“2 months after the halving bitcoin's done… well nothing… But reminder this was no different than 2016 which we know how that looks zoomed out.”
Bloomberg researchers: BTC’s 2016 similarities suggest a move to $20,000 is imminent
In the June edition of Bloomberg’s crypto outlook report, researchers also pointed to the striking similarities between 2016’s post-halving price action and that seen presently.
They conclude that these similarities suggest Bitcoin’s price is likely to rise towards its all-time highs of $20,000 by the end of this year.
“After 2014's 60% decline, by the end of 2016 the crypto about matched the 2013 peak. Fast forward four years and the second year after the almost 75% decline in 2018, Bitcoin will approach the record high of about $20,000 this year, in our view, if it follows 2016's trend.”
This possibility will likely depend on how BTC’s current sideways trading phase resolves.
Because many analysts view Bitcoin’s consolidation phase as being akin to a spring coiling up for a significant movement, a breakdown from here could spark a downtrend that spans throughout the rest of 2020.