Bitcoin volume profile shows major demand for BTC is building

Cover art/illustration via CryptoSlate. Image includes combined content which may include the use of AI tools.
Bitcoin’s price action has done little to offer investors with insight into its mid-term trend, as the cryptocurrency has formed a massive trading range between $10,000 and $12,000 throughout the past few weeks.
While zooming in and looking at BTC’s short-term trend, it does appear that the crypto is well-positioned to see some upside, as the ardent defense of the region between $9,900 and $10,000 throughout the past couple of weeks points to strength amongst bulls.
Despite the cryptocurrency’s mid-term outlook remaining somewhat unclear due to the multiple hurdles it faces, the digital asset's volume profile indicates that its market structure is incredibly healthy.
This isn’t the only technical factor currently playing in Bitcoin's asset’s favor. One analytics firm explained that there is an indicator that is currently showing striking similarities to that seen before the parabolic bull run in 2017.
The confluence of these factors seems to indicate that BTC could soon see significant further upside.
Bitcoin’s volume profile bodes well for its near-term outlook
At the time of writing, Bitcoin’s price is peaking above $11,000 for the first time in over two weeks, marking a striking rise from its recent lows of $9,900 that were set just over a week ago.
BTC has seen mixed price action as of late, making it difficult to interpret the significance of this latest push higher.
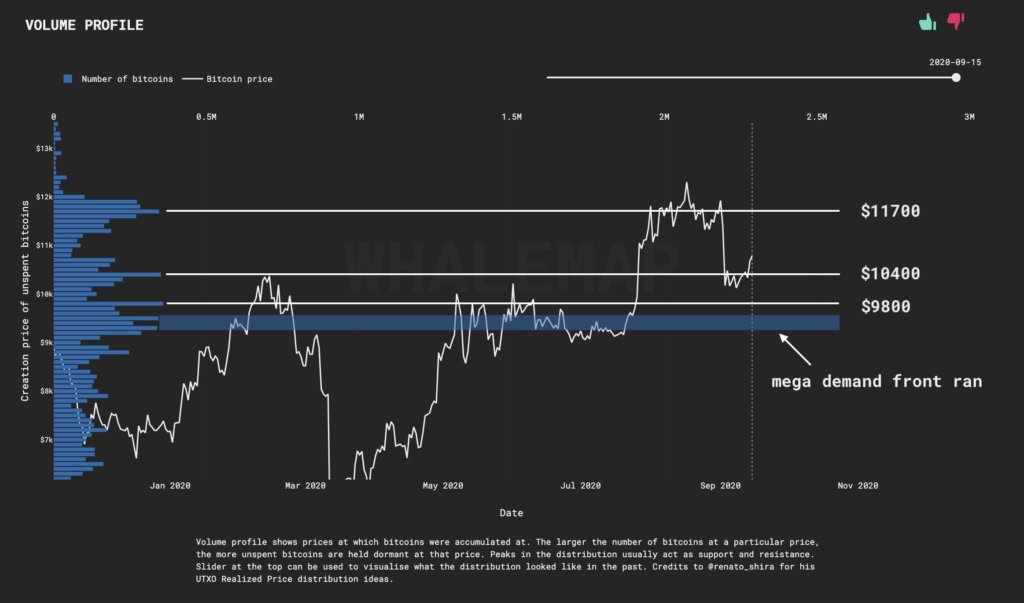
While looking towards the cryptocurrency’s volume profile, however, it appears that it may be well-positioned to push even higher in the near-term.
Whalemaps, an analytics firm focused on on-chain metrics, explained that the recent dip front ran the major demand zone within the mid-$9,000 region and allowed the crypto to confirm a few key levels as support.
“Volume profile shows healthy PA. Lets not forget that we successfully retested a couple of major supports/trendlines + successfully front ran some major demand at 9500-9300. Looks good…”
This indicator is flashing signs similar to those seen in 2017
While speaking about the cryptocurrency’s moving profits and losses indicators, the firm explained that a crossover between these two lines indicates that upside could be imminent in the near-term.
This crossover is also what took place just before the parabolic Bitcoin uptrend in 2017.
“Moving profits and losses are giving us 2017 bull run vibes.”

Because these crossovers have – without fail – taken place right before Bitcoin sees parabolic upswings, this could mean that a strong move higher is imminent.
For this to come to fruition, bulls must shatter the heavy selling pressure around $11,200 and $12,000.