 Key Analytics to Provide Liquidity in DeFi
 Key Analytics to Provide Liquidity in DeFi
Using these indicators can help to find pools that maximize yield and minimize risk.

Cover art/illustration via CryptoSlate. Image includes combined content which may include AI-generated content.
One of the most common ways to earn yield in DeFi is by providing liquidity in decentralized exchanges. While for new investors this may seem initially as a straightforward process to earn returns, providing liquidity successfully has more intricacies that one should be aware of. There are certain indicators that can help to make more informed decisions about which pools are the most convenient to provide liquidity.
First, it is key to understand where yields are coming from. Trading fees are paid by traders that use these liquidity pools as a service to transact between the underlying two coins. Most pools have yields that are sourced exclusively from these fees. But the source of yield can also come from liquidity mining programs, where certain tokens are issued as a reward to those that provide liquidity in certain pools. These tokens are issued by protocols that have an interest in a pool maintaining a fair amount of liquidity to accommodate trades and damp volatility on the price of the token. This way they periodically pay liquidity providers a fixed amount of coins for providing liquidity. These incentivized pools are usually labeled as ‘farms’.

In this screenshot, it can be seen that this TOKE/WETH pool is incentivized by Sushiswap and Tokemak protocol by rewarding a certain amount of tokens periodically. The total annual percentage return (90.69%) is composed mostly from liquidity mining rewards (87.99%), since the fees generated by traded volume between these two coins would accrue for a return of just 2.70%.
Monitoring liquidity provided
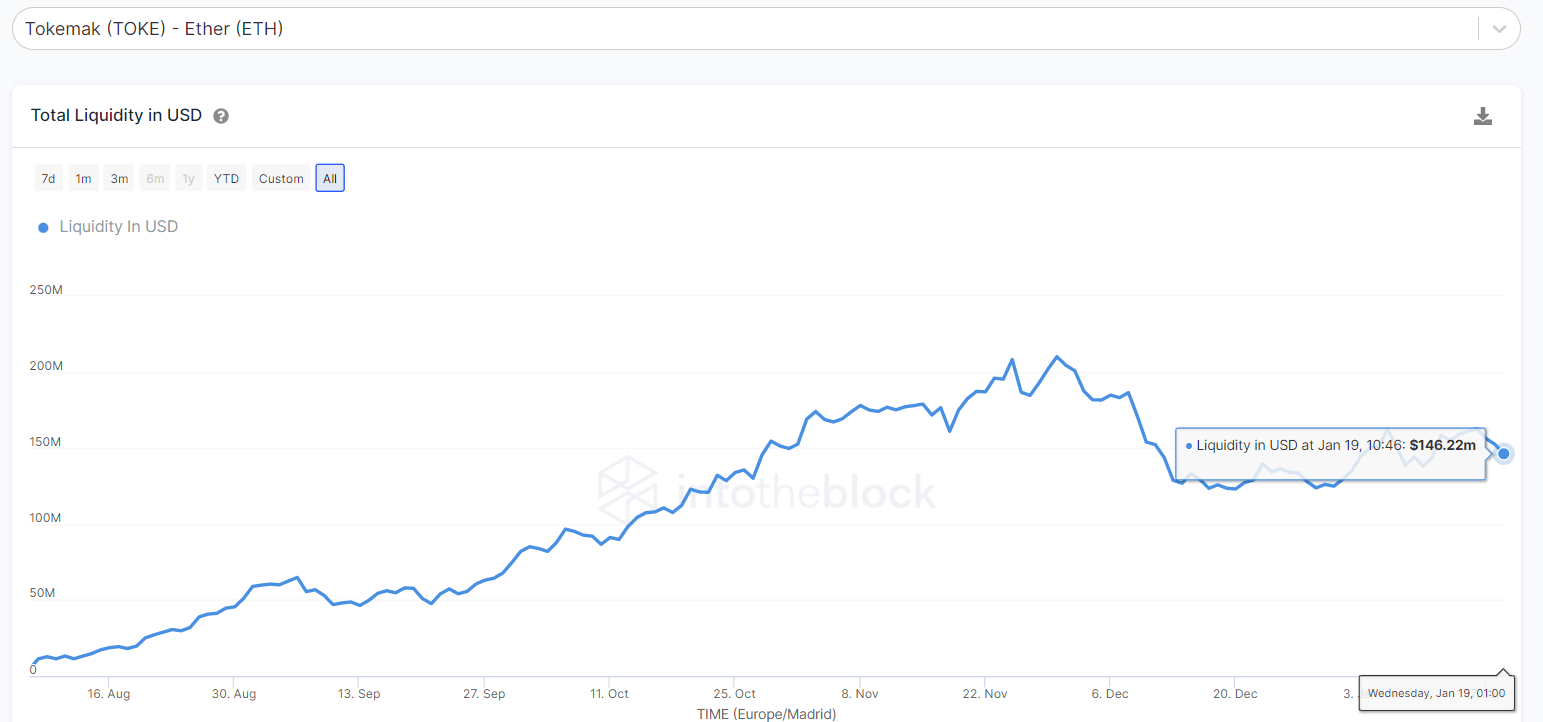
The total amount of liquidity available in a pool is a sum of the total value of each of the two tokens locked in a pool. An increase over time of the liquidity in a pool is a sign that the pool is rewarding distinctively and capital is flowing into it. Liquidity always follows yields. Thus, a sustained decrease of liquidity over time could signal that the yields offered in that pool are not so incentivizing anymore.
Furthermore, it could signal that traders suddenly have a bearish perspective of the price action of the underlying coin and fear a price drop that could result in them holding the majority of the underperforming coin (this is impermanent loss, but more about this will be covered later).

But there is a trade-off. An increase of liquidity means that the exchange fees (and coin rewards in the case of a farm) accrued by the pool have to be distributed among more investors that provided liquidity. This means that the expected return might decrease for each of the liquidity providers. Overall, liquidity that is not consistently decreasing tends to be a good indicator of the health of the pool.
Review the yield provided
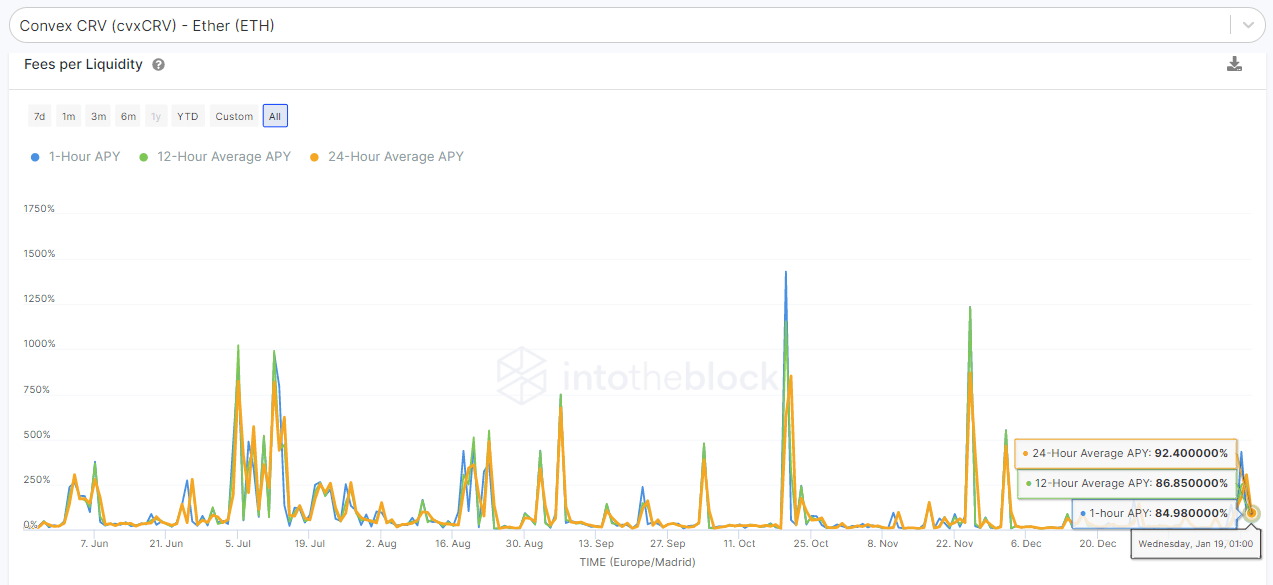
As seen on the Sushiswap farm example, non-incentivized pools that just rely on fees as rewards tend to return low yields. But that is not always the case and here is an example of a pool where it can potentially be very profitable to provide liquidity. The combination of a high trading volume and a relatively tight liquidity can amplify the yields of liquidity providers.

The APY calculated in this indicator is based just on trading fees; liquidity mining rewards are heavily variable per pool and are not included in this calculation. These fees earned are completely dependent on the volume traded on each pool, so it pays off to be monitoring it as well and checking if it does not consistently decrease over time. Remember, yield from trading fees is proportional to the volume traded but inversely proportional to liquidity provided.
Checking impermanent loss
Due to how an automatic market maker works, providing liquidity makes sense mostly when there is a positive expectation of the underlying price action of the coin. For example, if a pool is composed of TKN and ETH, and the perspective of the trader is that TKN will decrease in value relative to ETH, it would not make sense to provide liquidity because a liquidity provider would end up accumulating the worst performing coin (TKN) and losing on the best performer (ETH). due to the constant rebalancing of the pool
That idea can be put in perspective when providing liquidity with pools that contain assets that are in the interest of being accumulated over time by the liquidity provider. Maybe the store of value narrative and the idea of appreciation in the long term means that the price action of the coins is something relatively negligible. The best example would be a WBTC-ETH pool. A liquidity provider that just wants to accumulate as much BTC and ETH as possible would find it perfect, since it would be only accumulating a sum of both coins by providing liquidity.

But when there is a positive view on the future price of a coin there can be times when providing liquidity to a pool becomes less profitable than just holding both coins separately. This is due to the price divergence that happens between these two coins. Coins that are correlated in price have less impermanent loss risk, or even no impermanent loss at all if both coins have the same price (like a USDC-DAI pool).
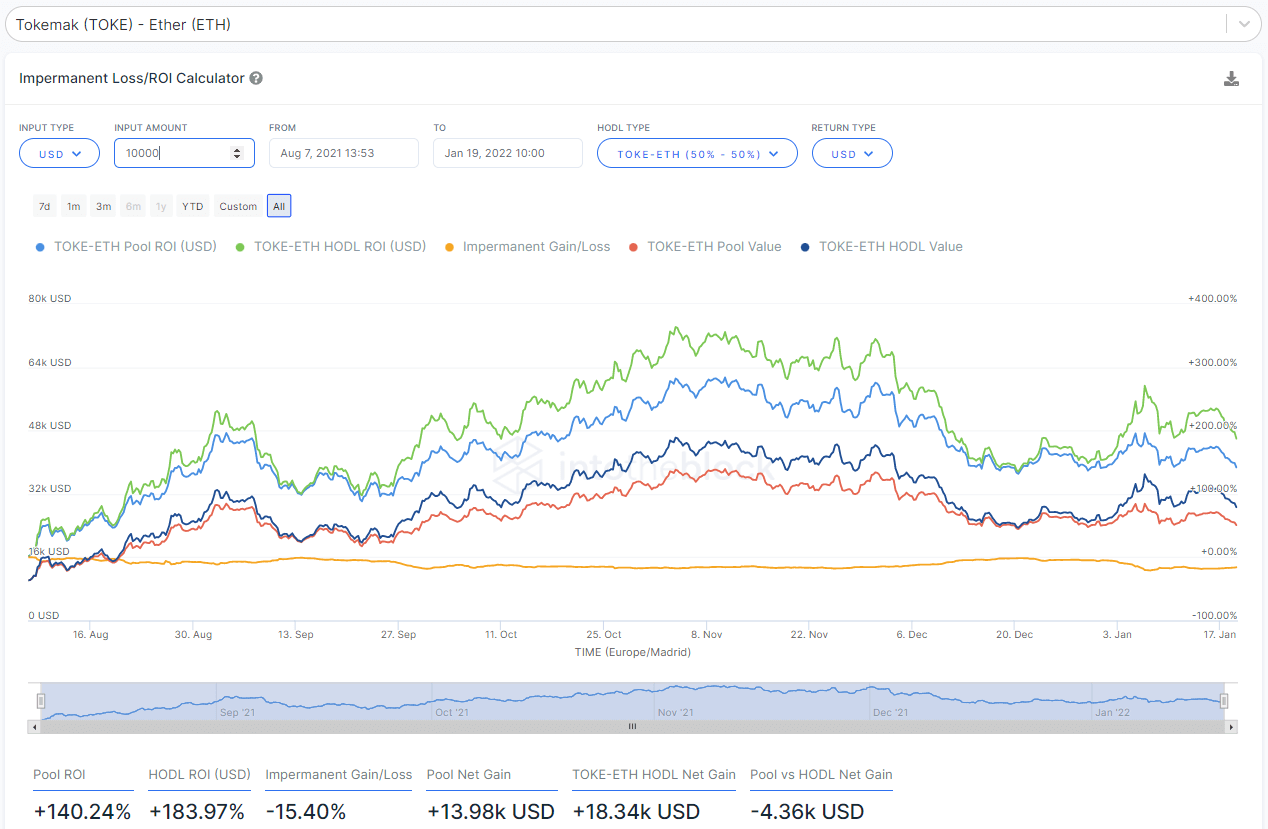
In the example below, providing liquidity to the TOKE-ETH pool would have gained 140% in USD terms since it was launched (not considering farming rewards, just trading fees and price appreciation). Holding both coins would have outperformed providing liquidity by 15% more. This impermanent loss is mitigated by the farming rewards seen before, accounting for 90% APR (without compounding) if both rewards and impermanent loss remain similar over time.
As a good rule of thumb for remembering impermanent loss equivalents, is that a change between prices of 2 times (for example a TKN-ETH pool where TKN doubles in price respective to ETH) is equivalent to a 5.7% loss. A change in price of 5 times would result in a 25.5% loss while a 10 times change would be a 42.5% loss.
For new DeFi users, Understanding these dynamics fully can be intimidating and it can require providing liquidity to pools several times to get used to the mechanics as well as continuously monitoring returns and replicating the calculations. Using these indicators can help to find pools that maximize yield and minimize risk.


 Farside Investors


 CoinGlass


