 Footprint Analytics: Can 2021 Foretell This Year’s Token Gains? | Annual Report 2021
 Footprint Analytics: Can 2021 Foretell This Year’s Token Gains? | Annual Report 2021
This article will review Token's biggest gains and most painful losses in 2021.

Cover art/illustration via CryptoSlate. Image includes combined content which may include AI-generated content.
In 2021, dozens of promising projects in DeFi, NFT, and GameFi brought more tokens to the market than any one person can follow. Whereas most tracked the price of BTC and ETH, we saw some new tokens buck this trend for the first time, and while many tokens saw astronomical gains, other projects got hacked and went to zero.
This article will review the biggest gains and most painful losses.

BTC Summary
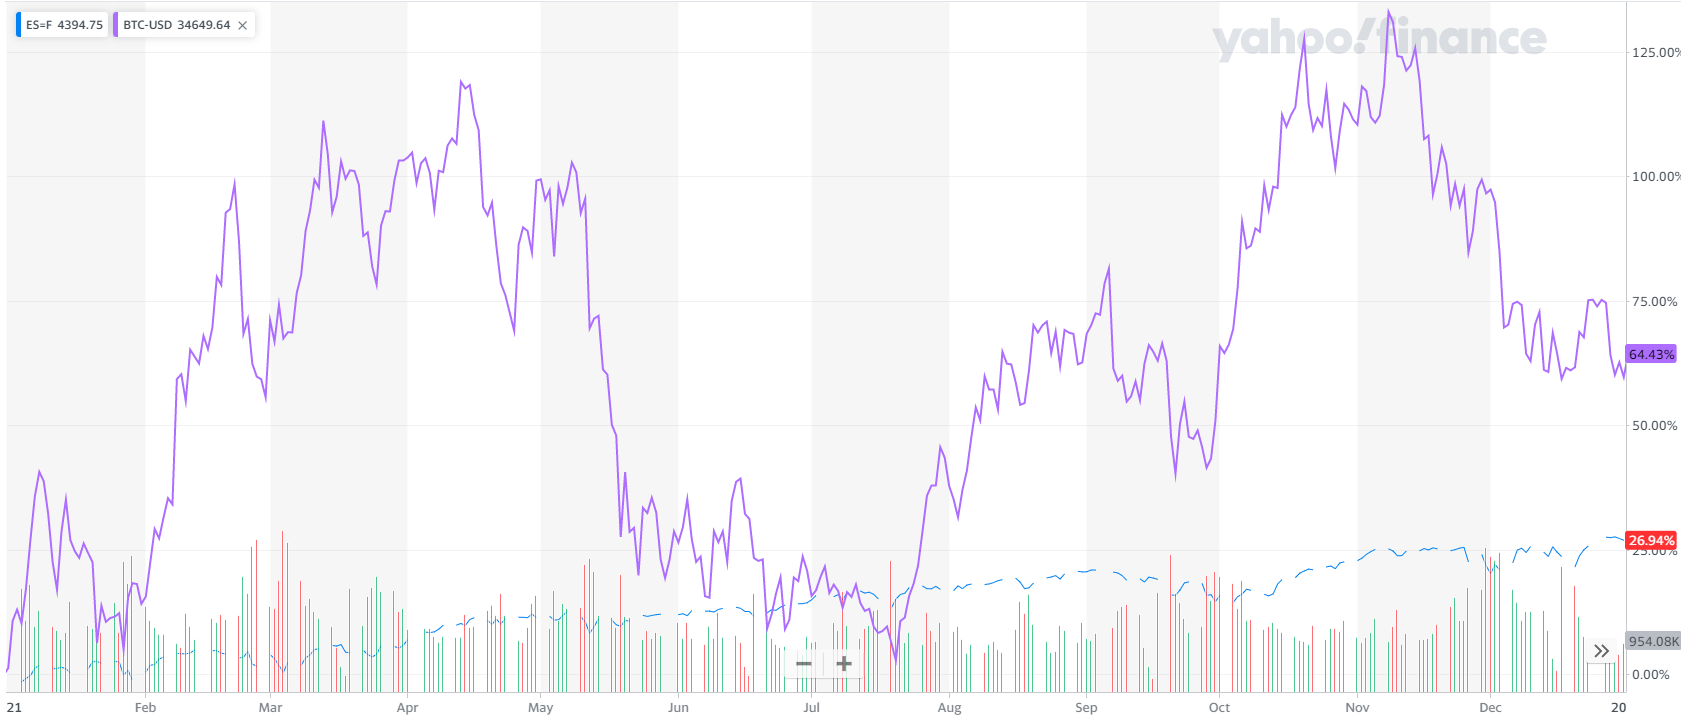
The price of BTC on Jan. 1, 2021 was about $29,000 and $47,000 by Dec. 31 it, an increase of 58.6%. BTC’s price action is a snapshot of the blockchain in 2021, with prices reflecting the market’s confidence and expectations in the space. Even if you don’t know what DeFi is, you can get a sense of the rapid growth of blockchain this year from the price of BTC.

Tokens Issued by Chains
Ethereum, the leading blockchain ecosystem, has risen from $738 to $3,761.

However, Ethereum’s high costs and network congestion have led to the emergency of dozens of solutions to allow the blockchain to scale. After the summer of DeFi, many of these new chains saw the price of their tokens multiply.
- BNB: Increased by 12x
- AVAX: Increased by 30x
- LUNA: Increased by 129x
- SOL: Increased by 112x
- MATIC: Increased by 144x

With the rapid development of high-performance public chains and EVM-compatible chains, DeFi projects are starting to migrate to multiple chains. Cross-chain solutions have become urgent.
As the cross-chain bridge covering the largest number of public chains, AnySwap’s $ANY has grown 105x from $0.17 to $16.97 in 2021.

Metaverse Tokens
NFT and metaverse project started grabbing headline attention in the second half of the year. Since most NFT projects do not issue tokens, we can focus on GameFi data.
- $AXS: A token issued by Axie Infinity, a play-to-earn game, whose price increased 178x.
- $SAND: An ERC20 token for the blockchain game “The Sandbox”, which revolves around virtual estate game, grew 162x.
- $COCOS and $GALA are both tokens issued by the GameFi service chain. People value their potential to become the future infrastructure of the metaverse, with $GALA rising over 300x and $COCOS rising over 8000x in 2021. The token prices fully reflect future expectations.

Some Tokens Went Bust
Despite record profits, not everyone made a fortune. Blockchain remains a high-risk investment, as some tokens which got completely zeroed out made clear.
Tokens that Fell to Vulnerability Attacks
$BUNNY: On May 20, PancakeBunny was attacked by a flash loan and a token flash crash. The event resulted in a total loss of 114,631 BNBs and 697,245 BUNNYs, or approximately $42 million in contracts at that time’s price. The price of BUNNY coin also dropped from $232 to $11. The current price of BUNNY is $1.07.
$CREAM: 2021 was a nightmare for Cream Finance as the protocol was hacked five times with losses of about $200 million. In one attack after another, CREAM’s price gradually dropped from a high of $370 to $37, a drop of about 90%.

Tokens Zeroed Out From Bank Runs
$TITAN: Iron Finance is an algorithmic stablecoin project based on Polygon’s partial collateral. Its troubles started on June 16, when a giant whale made a sell-off, which in turn led to market panic and eventually a massive user sell-off. Combined with the failure of the token minting mechanism, 27 trillion TITAN were minted, which caused the price of TITAN to go straight to zero from a high of $64 in just 16 hours.
This event was a true DeFi bank run. With an extremely panicked market, the short-term surge in demand for withdrawals by depositors triggered a run that eventually led to the collapse of the system.

A Note on Exclusions

In 2021, there was no shortage of tokens with extremely high growth rates, especially meme tokens.
SHIB’s price, for example, grew more than 3,000x. However, such tokens lack application scenarios, so we did not include them in our guide.
In 2022, assess the potential of each public chain and focus on cross-chain services, which will likely become the main focus in blockchain development. At the same time, keep up with emerging fields—above all else, this industry evolves quickly.
Benefits for CryptoSlate Readers
From 11 to 25 January 2022, click this hyperlink on CryptoSlate to get a free 7-day trial of Footprint Analytics! New users only!
Date & Author: Jan 11th, 2022, Amanda
Data Source: Footprint Analytics – 2021 Token Review
This article is part of our Year in Review series.
What is Footprint
Footprint Analytics is an all-in-one analysis platform to visualize blockchain data and discover insights. It cleans and integrates on-chain data so users of any experience level can quickly start researching tokens, projects and protocols. With over a thousand dashboard templates plus a drag-and-drop interface, anyone can build their own customized charts in minutes. Uncover blockchain data and invest smarter with Footprint.


 Farside Investors


