 Bitcoin long liquidation dominance hits 70% in June amid 2024 market volatility
 On-chain Highlights
DEFINITION: The percentage of long liquidations out of all liquidations in a given timeframe, i.e., long liquidations / (long liquidations + short liquidations). In percentage terms, 50% means that there have been an equal amount of long and short liquidations, while values above 50% indicate more long liquidations, and values below 50% indicate a higher amount of short liquidation.
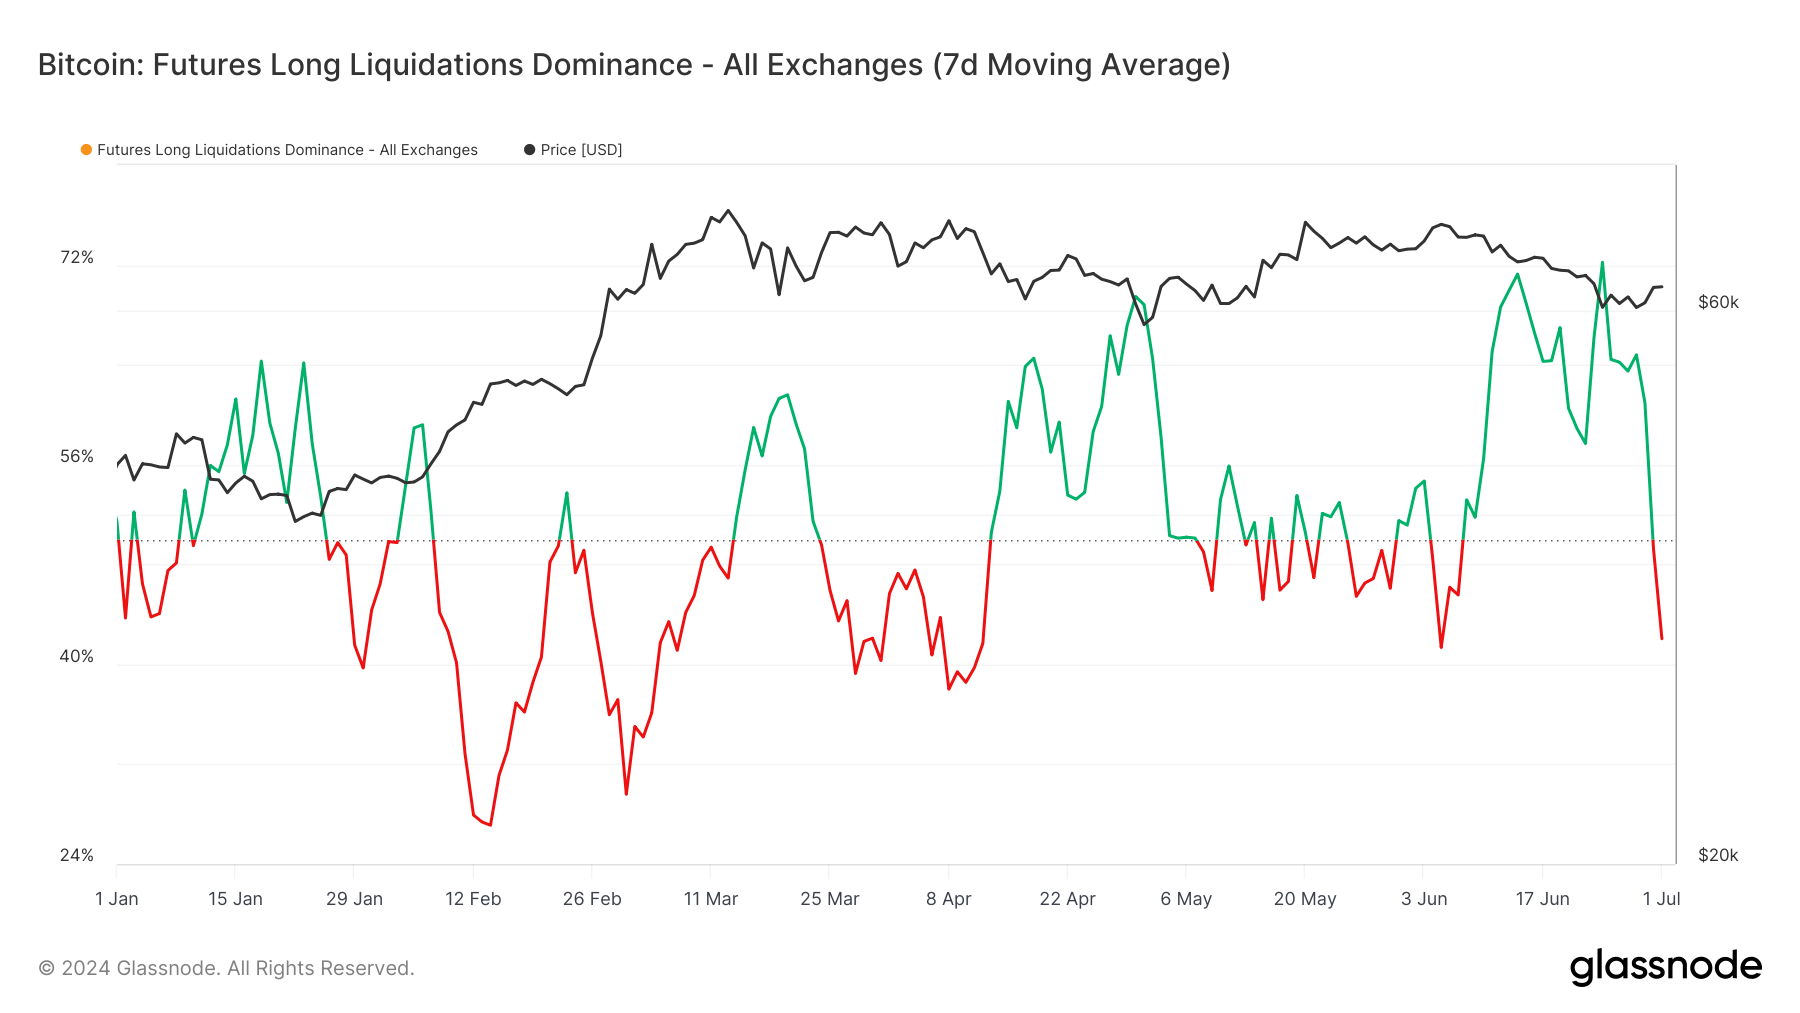
Bitcoin’s long liquidation dominance across all exchanges has fluctuated significantly in 2024, reflecting volatility in market sentiment. The seven-day moving average data reveals periods of increased long liquidations, especially in April and June. Notably, these spikes in liquidation dominance coincide with significant price movements.

In March, the dominance of long liquidations surged above 60%, correlating with a notable decline in Bitcoin’s price from approximately $70,000 to $60,000. This trend illustrates the impact of market corrections on leveraged positions.
Similarly, June saw another increase in long liquidations, with dominance briefly touching 70% as Bitcoin’s price hovered around $60,000, indicating heightened market instability and risk aversion among traders.
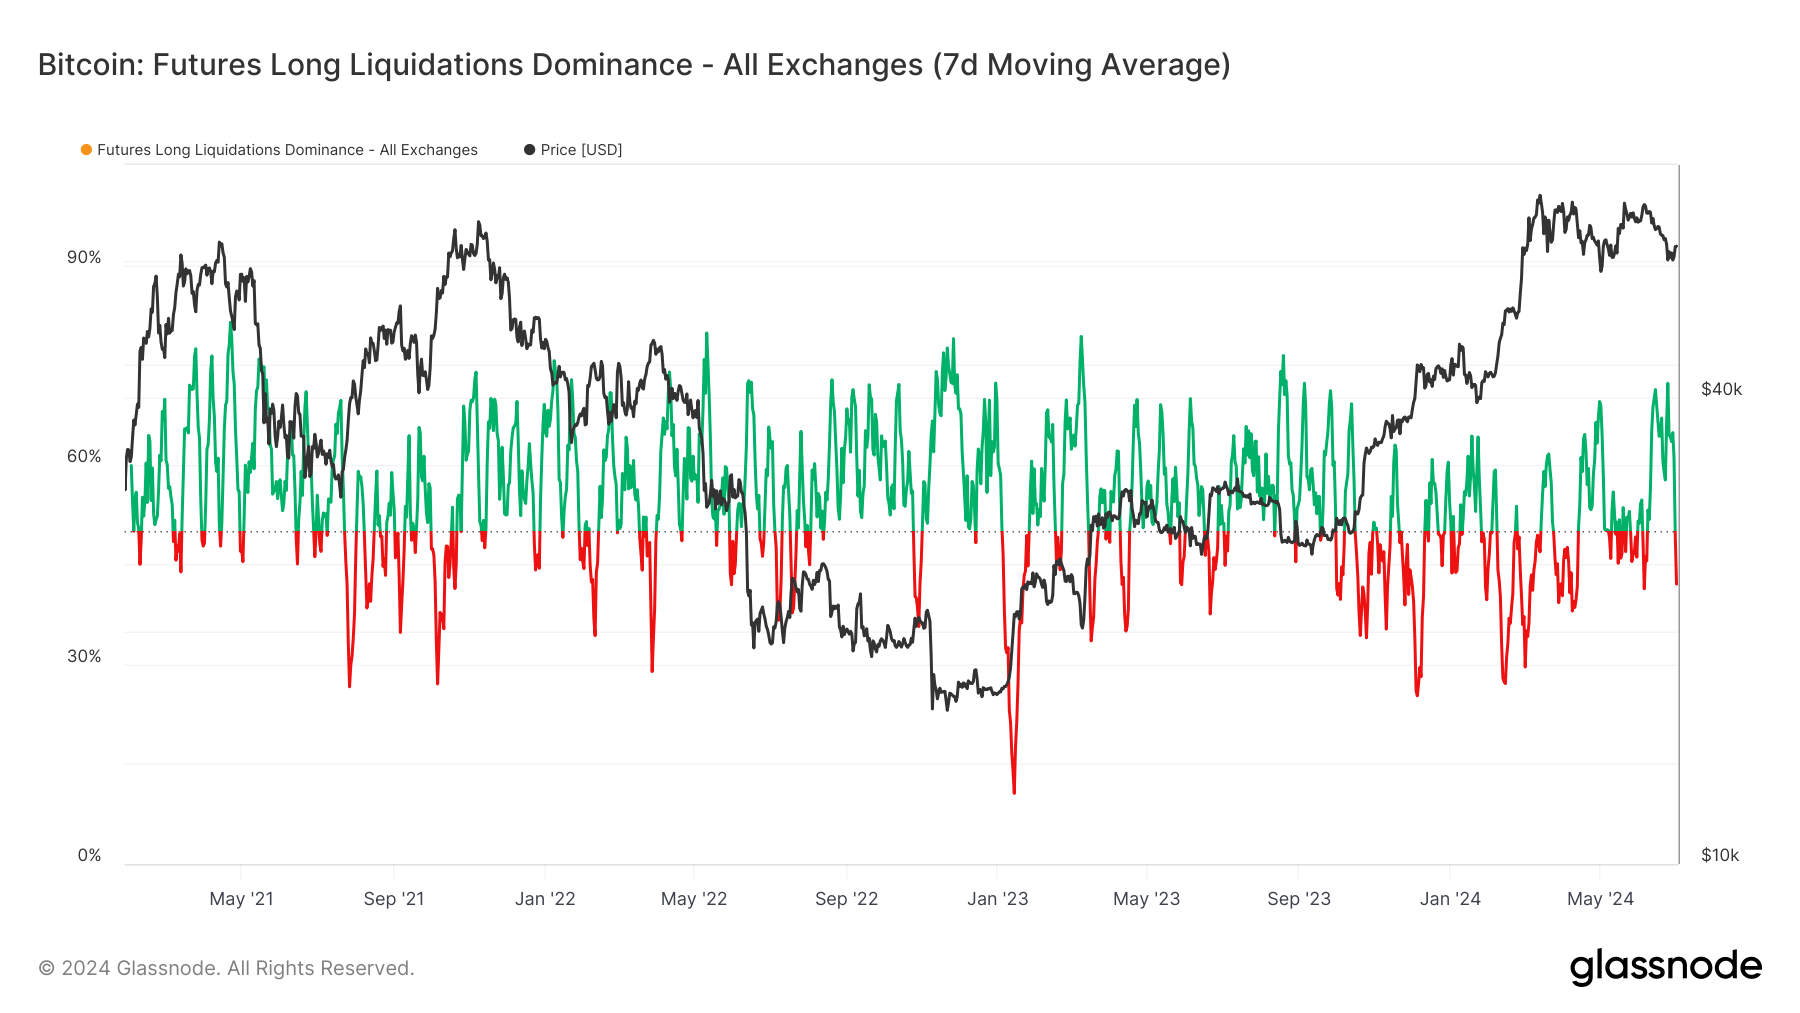
The broader trend over the past three years shows that while Bitcoin’s price has risen, the long liquidation dominance has experienced periodic surges, suggesting persistent volatility and the influence of macroeconomic factors on trader behavior. Understanding these trends is crucial for market participants to navigate the complex landscape of Bitcoin futures trading.


 CryptoQuant


