 Bitcoin accumulation trend shifts as entities increased holdings ahead of 2024 halving
 Onchain Highlights
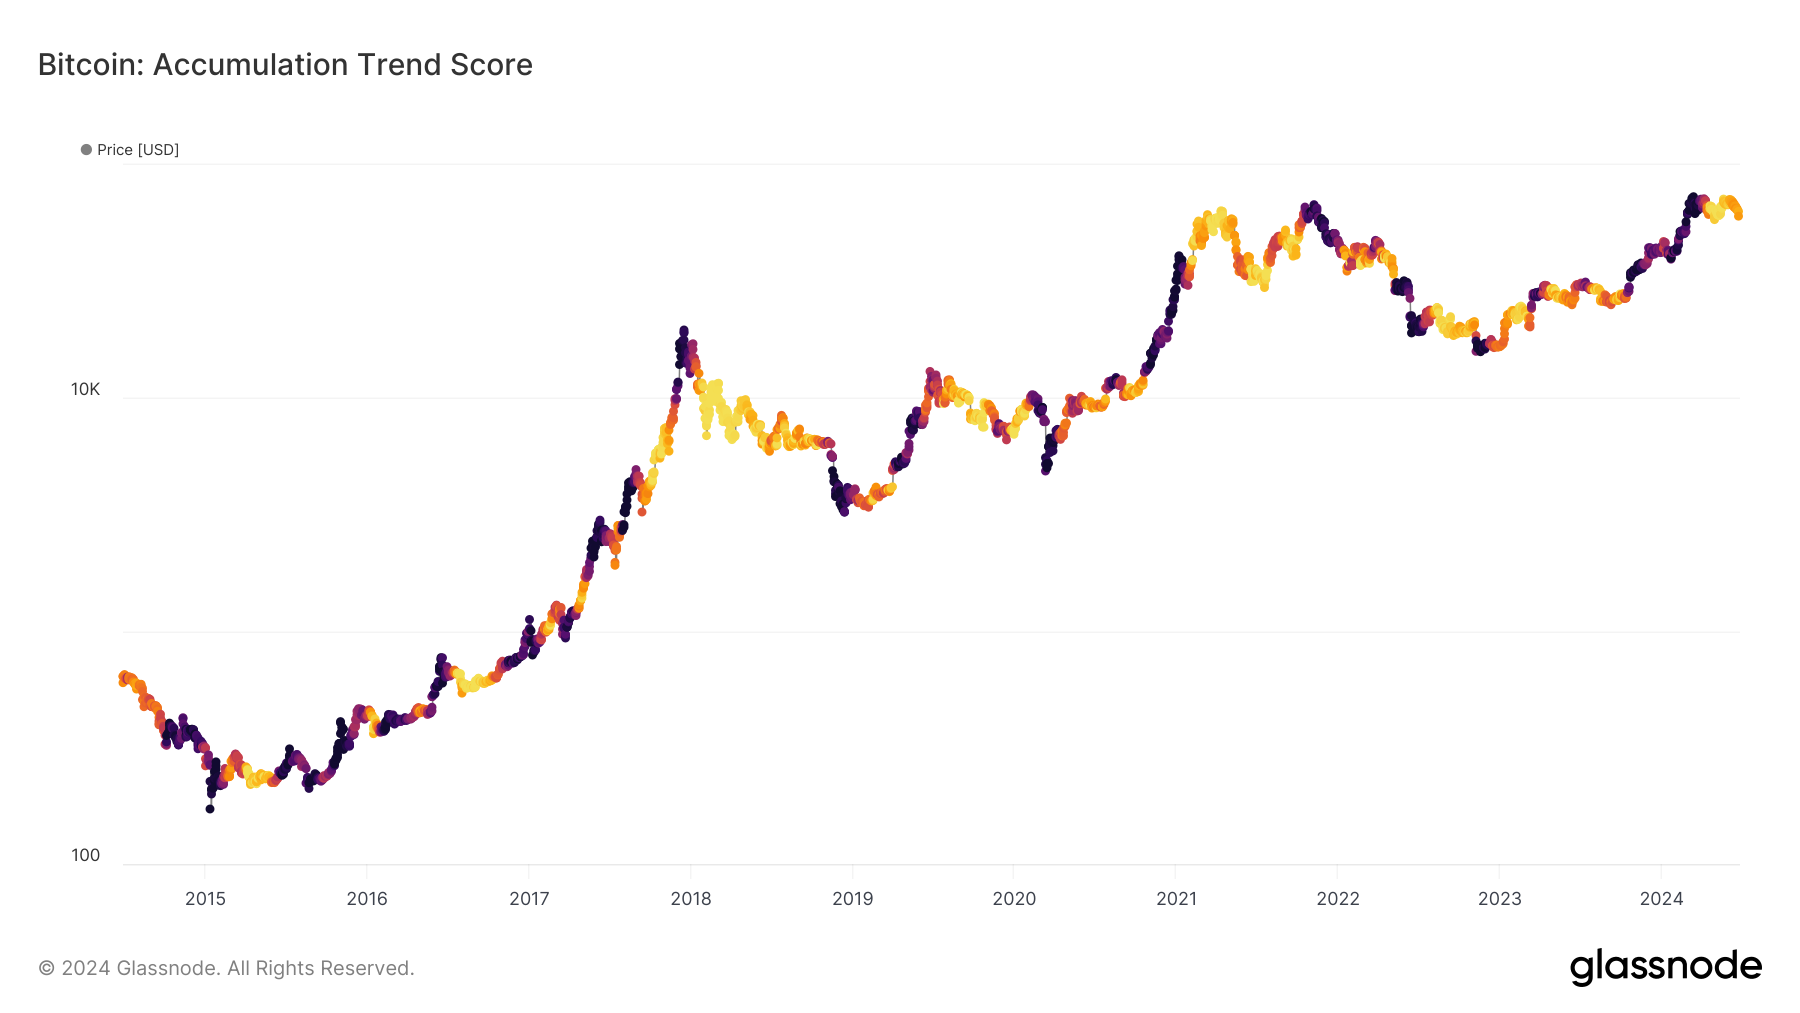
DEFINITION: The Accumulation Trend Score is an indicator that reflects the relative size of entities that are actively accumulating coins on-chain in terms of their BTC holdings. The scale of the Accumulation Trend Score represents both the size of the entities balance (their participation score), and the amount of new coins they have acquired/sold over the last month (their balance change score). An Accumulation Trend Score of closer to 1 indicates that on aggregate, larger entities (or a big part of the network) are accumulating, and a value closer to 0 indicates they are distributing or not accumulating.
Bitcoin’s accumulation trend score reveals significant insights into market participants’ behavior. Historical data from Glassnode highlights evolving accumulation patterns. Early stages in 2015 and 2016 show sporadic accumulation, reflecting cautious investor approaches. Significant accumulation began during the 2017 bull run, driven by rising prices and increased mainstream attention.

The 2018 and 2019 bear market saw decreased accumulation, indicating distribution and lower confidence. However, 2020 and 2021 marked a rise in accumulation, particularly in response to economic uncertainty during the COVID-19 pandemic, with notable institutional purchases from entities like MicroStrategy and Tesla. In 2021, the score spiked during the bull run, peaking with new all-time highs, followed by a period of distribution as the market corrected.
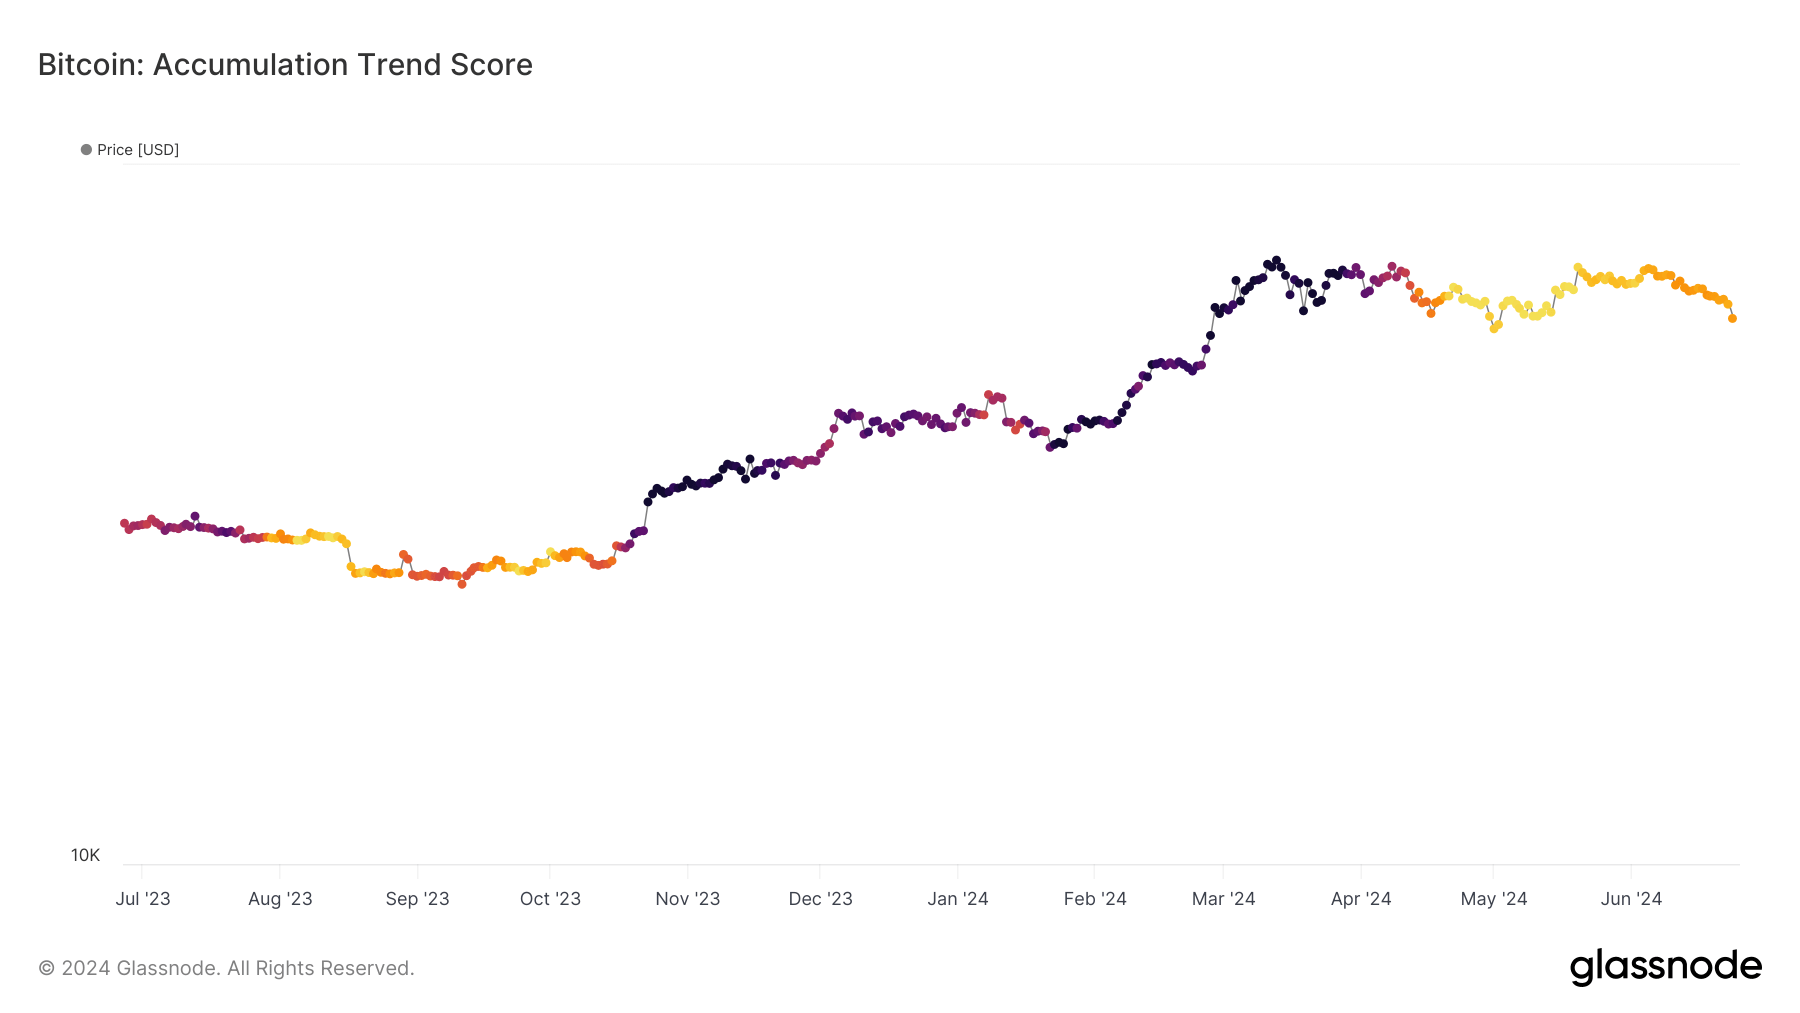
From mid-2023 through mid-2024, there’s a notable increase in accumulation, especially pre-April 2024 halving, entities appeared to be strategically increasing their holdings.


 CryptoQuant


