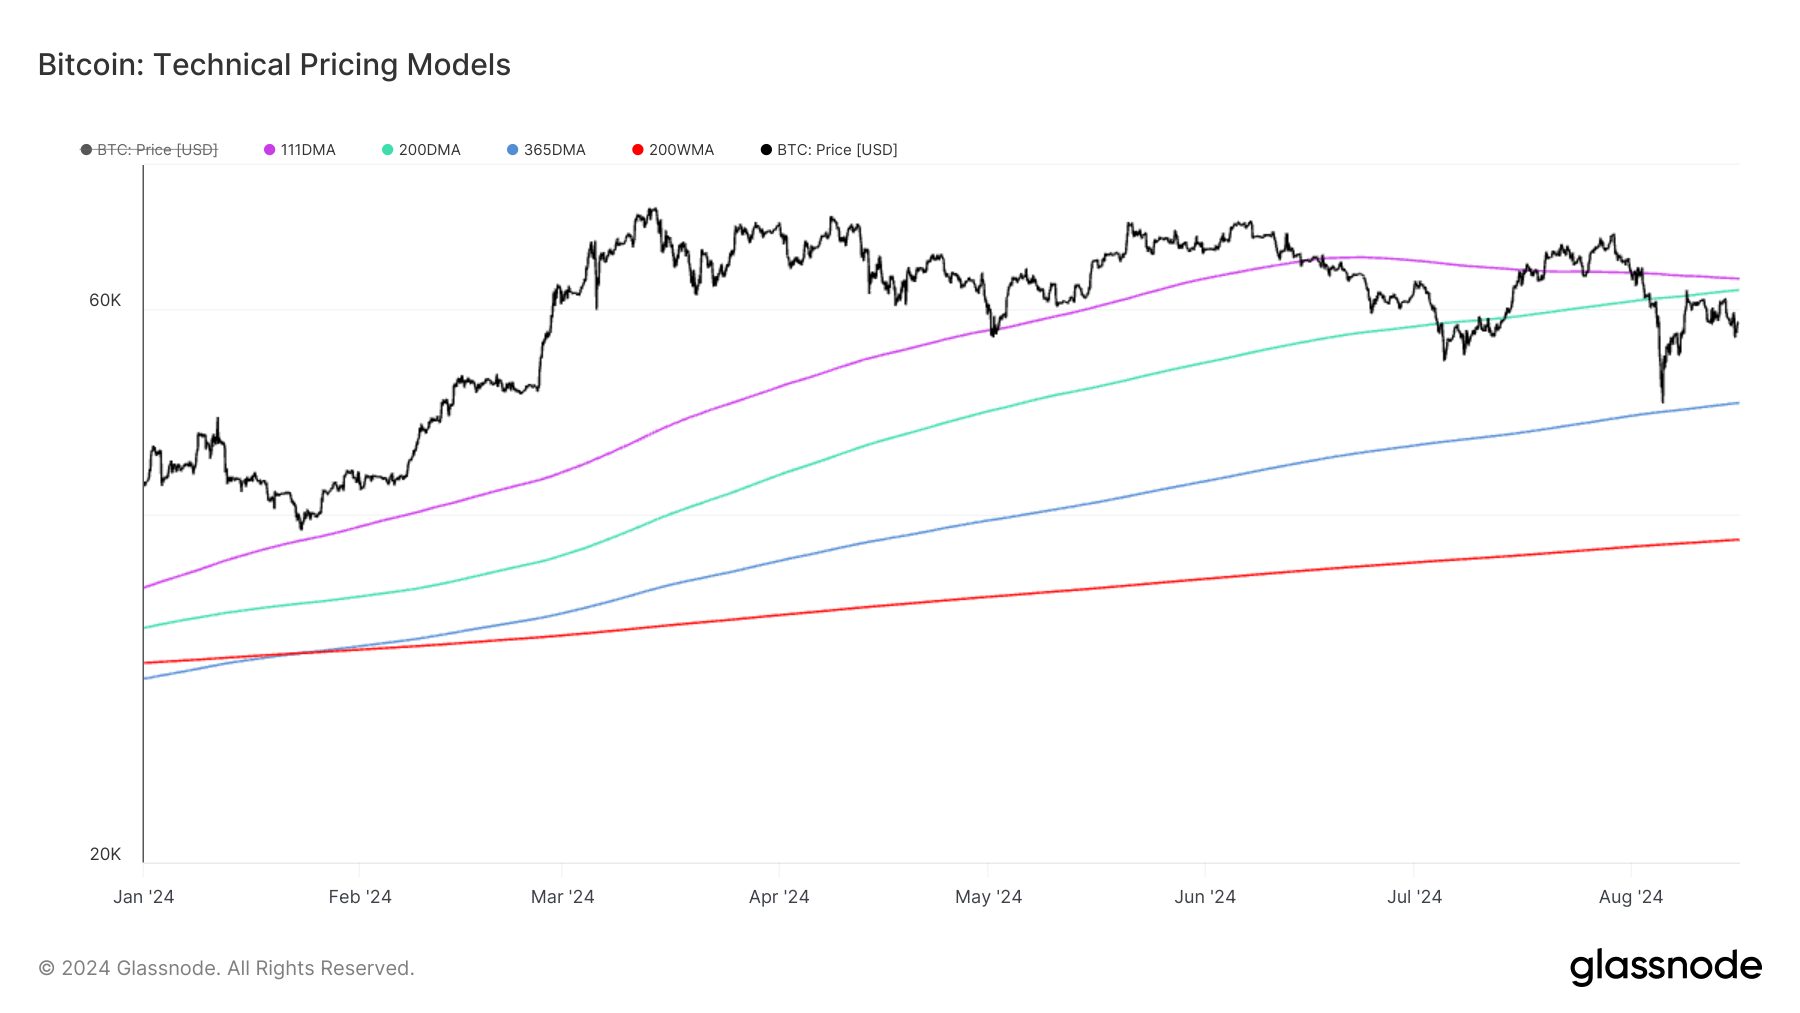
As of press time, Bitcoin is trading below $60,000, placing it in a precarious position due to it being below key moving averages, particularly the 200-day moving average (200 DMA) at $62,300. It recently bounced off the lows of the 365-day moving average (365 DMA) around $49,000, showing some support and highlighting market uncertainty.
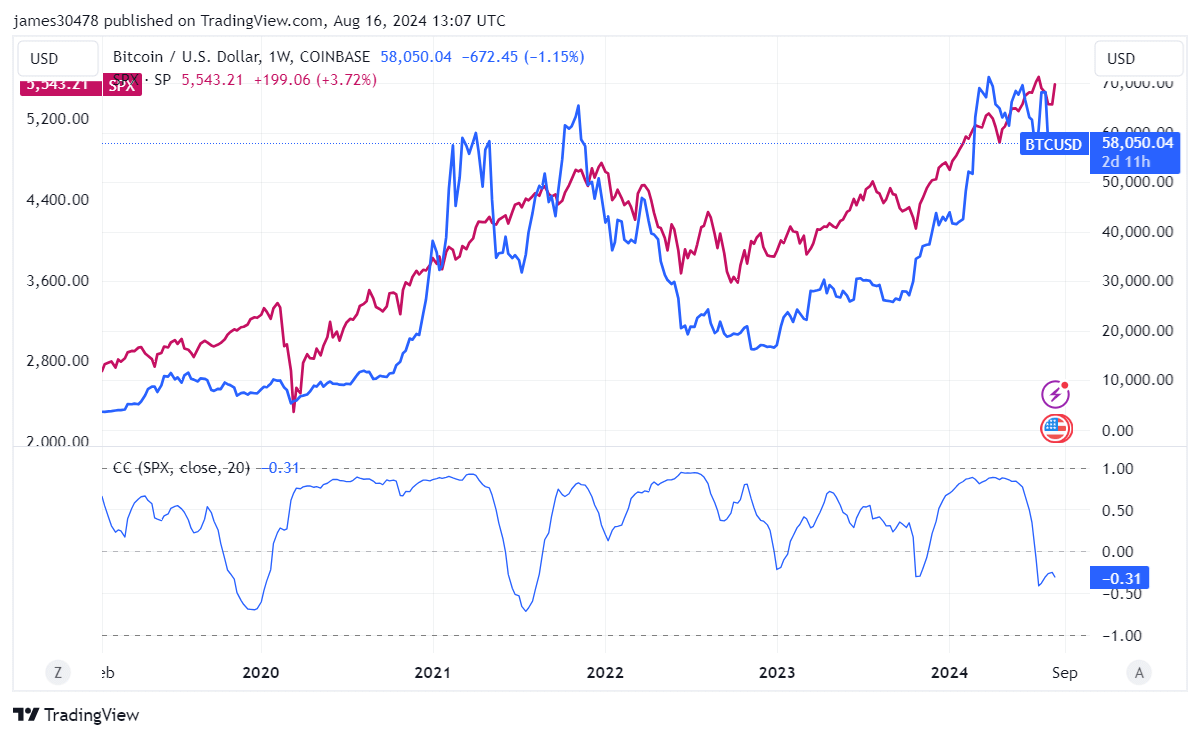
This uncertainty is linked to the ongoing rallies in both the S&P 500 (SPX) and gold. Gold continues to hit all-time highs (ATHs), while the SPX trades just 2% below its ATH, showcasing a strong performance. Notably, Bitcoin and the SPX are negatively correlated, a pattern that has emerged since late June.
BTCUSD vs SPX: (Source: TradingView)
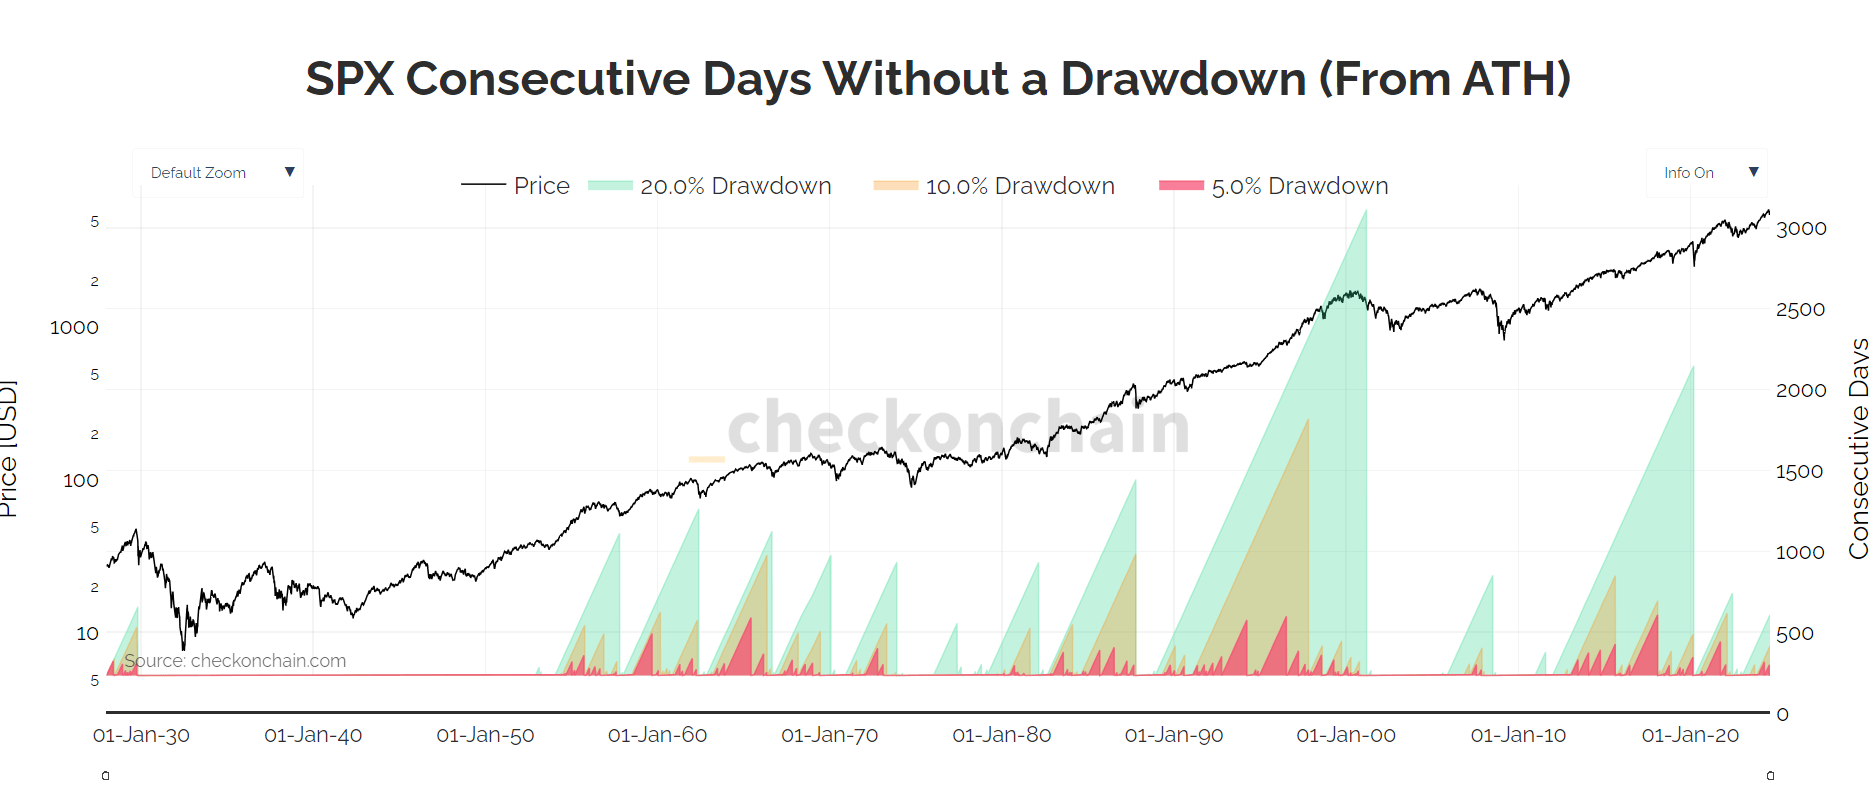
Analyzing the SPX's performance, it has been three days since a 5% drawdown, 197 days since a 10% drawdown, and 403 days without a 20% correction. Historically, this is one of the best periods for the SPX without a severe drawdown, with the record being 3,084 days without a 20% correction in 1999/2000. Given this historical context, the SPX may continue its upward trend while Bitcoin faces challenges. Bitcoin is currently 22% down from its all-time high.
SPX Consecutive Days without a drawdown from ATH: (Source: Checkonchain)