 Data shows Chainlink network is growing exponentially as its community becomes more optimistic
 Data shows Chainlink network is growing exponentially as its community becomes more optimistic

Cover art/illustration via CryptoSlate. Image includes combined content which may include AI-generated content.
The Chainlink network is growing at an exponential rate, according to data from IntoTheBlock. Every day, more addresses are created and the number of holders continues rising. The positivity around LINK can be seen across all social media platforms, which could be a sign of a further price appreciation.
Chainlink network stats show strength of the network
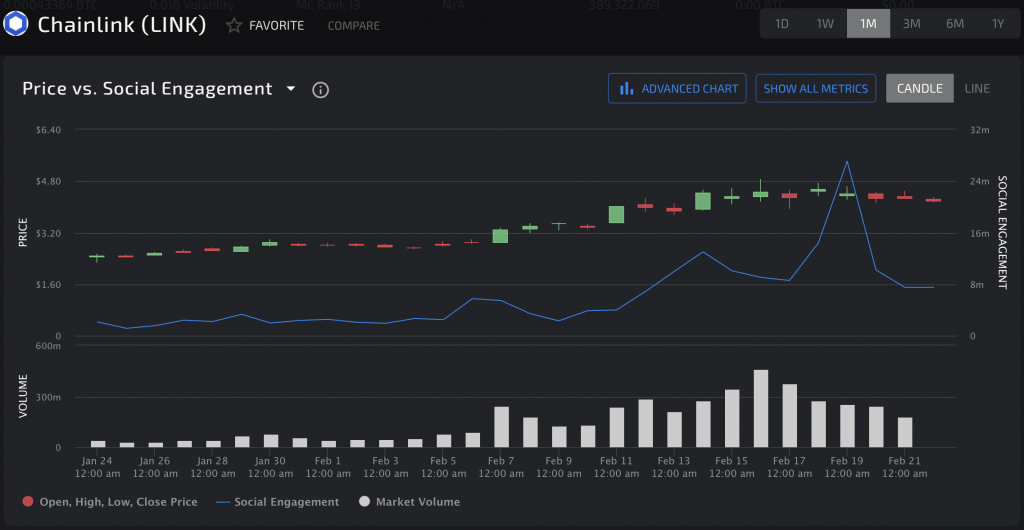
Since the beginning of the year, Chainlink entered a massive bull rally that has seen its price surge by 187 percent. This cryptocurrency went from trading at a low of $1.70 to hit a new all-time high of $4.88 on Feb. 19. Following the peak, LINK entered a corrective period that has pushed its down over 15 percent.
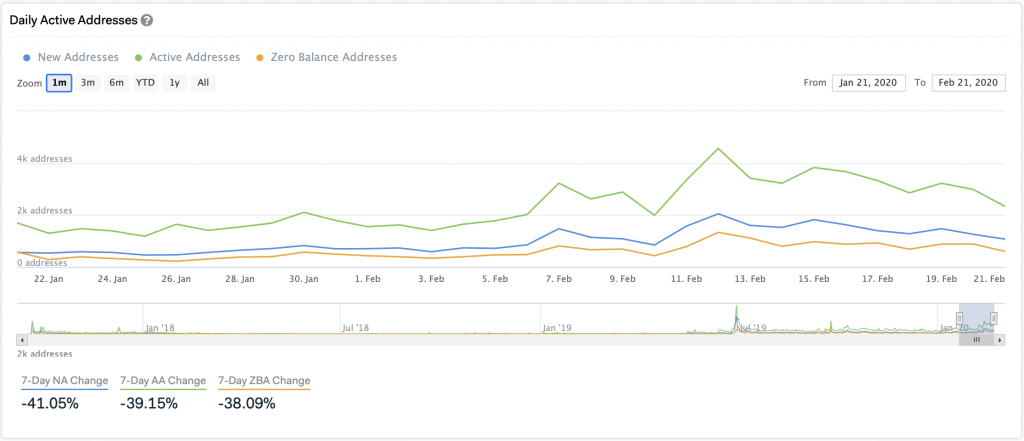
Despite the substantial retracement that Chainlink experienced over the past few days, the interest that market participants have shown for it continues rising. According to IntoTheBlock, a machine learning and statistics modeling firm, there were a total average of 1,480 new addresses created per day over the past week. This outweighs the number of addresses that went zero, which only represents 862 addresses per day.
Chainlink’s network grew by a whopping 4,300 addresses in the past seven days and a similar behavior can be seen on the number of addresses that are holding LINK for a long period of time.

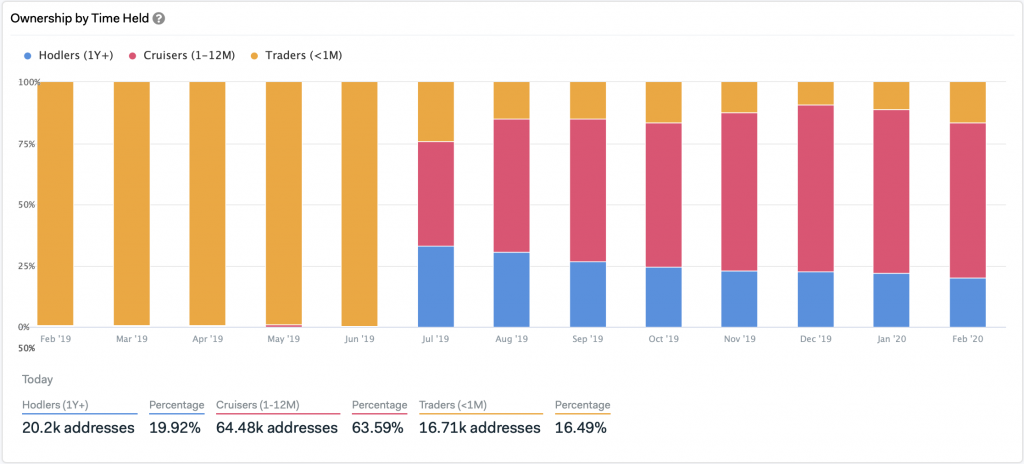
IntoTheBlock’s Ownership by Time Held statistical model evaluates those addresses that have held an asset for more than a year and defines them as “hodlers.” The ones that have a holding period of one to twelve months are “cruisers” and those who hold an asset for less than a month are “traders.”
Based on this gauge, there are over 20,000 Chainlink hodlers, representing more than 20 percent of the total addresses with a balance in LINK. Meanwhile, 63.72 percent of all addresses are considered to be cruisers since they hold this cryptocurrency for a period between one to twelve months. New addresses entering the network and actively trading LINK only represent 16.27 percent with over 16,000 addresses.

The trust that investors seem to be putting on LINK as an investment vehicle can also be perceived throughout social media. The Chainlink community is becoming more socially engaged over time as the community engagement metrics appear to have skyrocketed over the past month.
The community is becoming more engaged
Chainlink’s social engagement appears to have exploded since the beginning of February, according to crypto insights provider LunarCRUSH. The California-based company revealed that LINK’s community engagement first spiked on Feb. 3, with over 5.7 million engagements on that day alone.
Nonetheless, 16 days later this crypto’s social engagement went through the roof with over 27 million engagements.

LunarCRUSH evaluates the depth of community interaction across all social posts. These include favorites, likes, comments, replies, retweets, quotes, shares, and other metrics. The community insights analytics firm believes that these metrics help determine how engaged a community is around a given cryptocurrency.
Over the past 24 hours, close to 80 percent of all the social interactions across multiple social media platforms have been bullish about Chainlink, based on data from LunarCRUSH. The positive attitude that investors have towards LINK, however, could be seen as a negative sign considering that one of the most successful investors in the world, Warren Buffet, once said:
“Be fearful when others are greedy and greedy when others are fearful.”
A thin barrier of support
Chainlink has been mostly consolidating within a narrow trading rage over the past week. This range is defined by the $4 support level and the $4.87 resistance level. Due to the extended period of time that LINK has been contained within this area, it can be considered a reasonable no-trade zone. Breaking below or above it would likely determine where Chaninlink is heading next.
It is worth noting that the 78.6 percent Fibonacci retracement level, which is currently serving as support, has been constantly tested in the last eight days. Therefore, the strength of this barrier could be weakening over time.
Additionally, the TD sequential indicator is currently on a green eight candlestick on LINK’s 3-day chart. In approximately a day a twelve hours a new candlestick will form, which would likely be a green nine candlestick. This type of candlestick is considered a sell signal based on this technical index. It estimates a one to four candlesticks correction before the continuation of the bullish trend.
If validated, Chainlink could experience a significant correction for the first time since it entered a bull rally in mid-December 2019. On its way down, LINK could find support around the 61.8, 50, or 38.2 percent Fibonacci retracement levels. These support barriers sit at $3.64, $3.26, and $2.87, respectively.
Nevertheless, due to the optimism that can be seen on Chainlink’s network and its community, the bullish outlook cannot be voided. As a result, the $4.87 resistance level could be the catalyst that pushes this cryptocurrency even further up. Closing above this hurdle could trigger an upswing to the next resistance levels that sit between $5.76 and $6.88.
Now, it is just a matter of time before LINK breaks below support or above resistance. In the event of a steep correction, investors should consider that a price drop would represent an opportunity for sidelined investors to get back into the market. A new inflow of capital could eventually push the price on LINK to higher highs.
Chainlink Market Data
At the time of press 12:59 pm UTC on Feb. 22, 2020, Chainlink is ranked #12 by market cap and the price is down 4.11% over the past 24 hours. Chainlink has a market capitalization of $1.49 billion with a 24-hour trading volume of $315.97 million. Learn more about Chainlink ›
Crypto Market Summary
At the time of press 12:59 pm UTC on Feb. 22, 2020, the total crypto market is valued at at $280.66 billion with a 24-hour volume of $133.71 billion. Bitcoin dominance is currently at 62.70%. Learn more about the crypto market ›


 CryptoQuant


