Technical Analysis May 13: Bitcoin, Ethereum, Bitcoin Cash, Litecoin and Ripple

Photo by Ganapathy Kumar on Unsplash
Cryptocurrency markets are starting to rebound after a $70 billion drop in just two days. Historically, cryptocurrencies have seen enormous gains during Consensus, a blockchain technology conference in New York taking place this week. This article will look into the current price of Bitcoin, Ethereum, Litecoin, Ripple and Bitcoin Cash using technical analysis tools.
Disclaimer: This article is not meant to constitute trading/investment advice. Please use extreme caution when trading any cryptocurrency.
For the purposes of this article, we will be using a handful of terminology that non-technical traders may not be familiar with. These terms are at the end of this article under “Glossary.” If you would like to read those terms now, click here.
Bitcoin
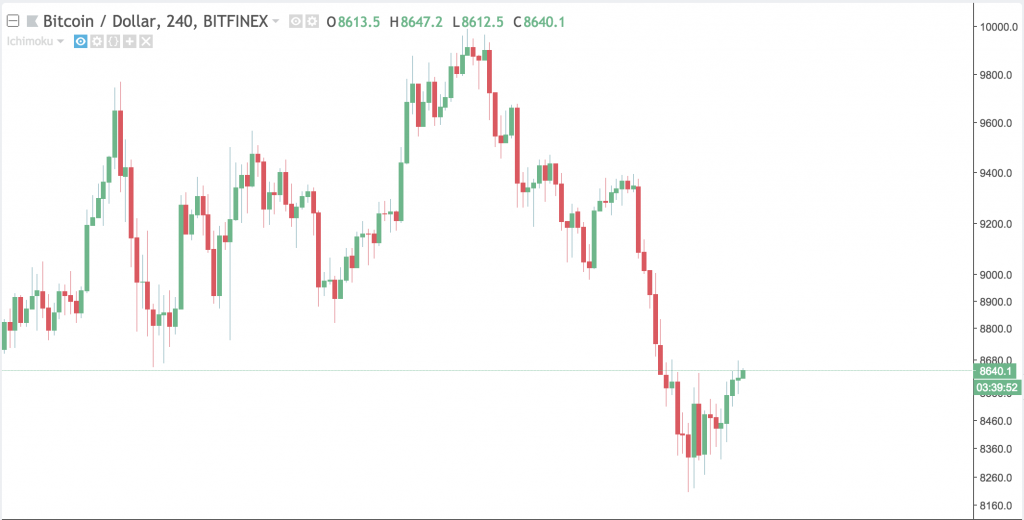
Starting off, we have Bitcoin, which saw a drop from $9,900 to $8,300 in under six days. This volatility is not anything we haven't seen before, but was a surprise to many after the upward trend looked to be continuing.
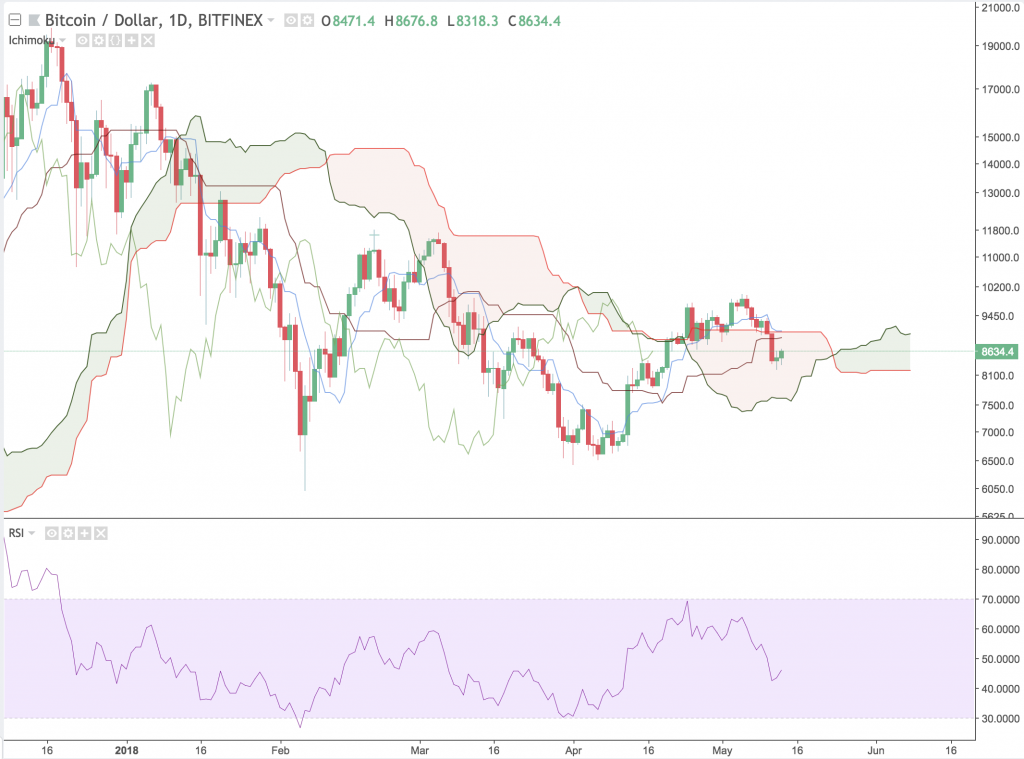
On the 1-day, Bitcoin is currently sitting inside the cloud, below the Tenkan and Kijun Sen. These lines are sloping towards each other, indicating high momentum and a possible TK cross. While the TK Cross hasn't formed yet, crosses inside the cloud are a bearish signal. The Tenkan-Sen is the faster-moving average and is currently on top, so if price starts moving back up the cross can be avoided.
As far as RSI goes, we see the same bearish divergence that we saw last week before this drop.
Ethereum
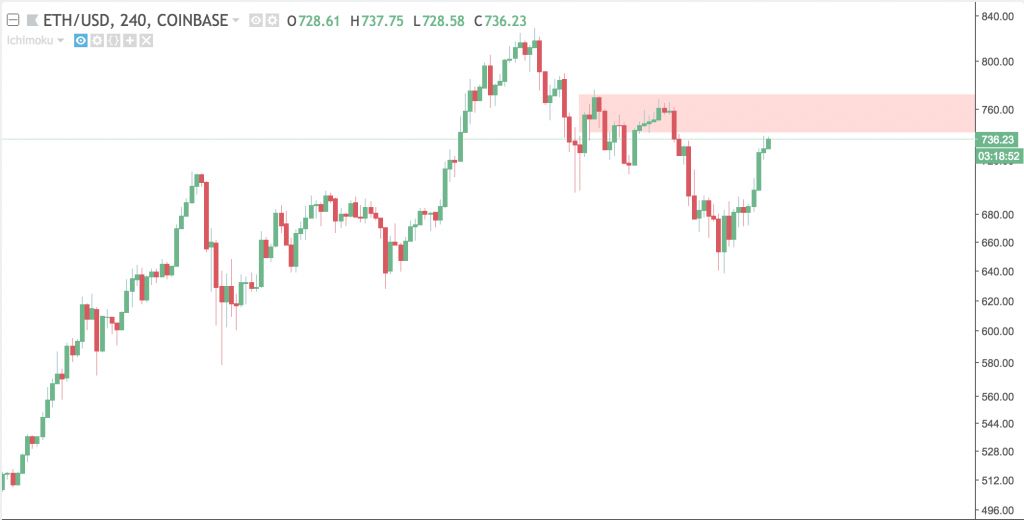
Ethereum saw a violent drop too, going from its local high of $820 to a low of $640. On a 4-hour time frame, we have local resistance starting in the red area. Price has been rejected three times and could again. To capitalize on basic support and resistance bounces, use lower time frames such as 1-hour charts.
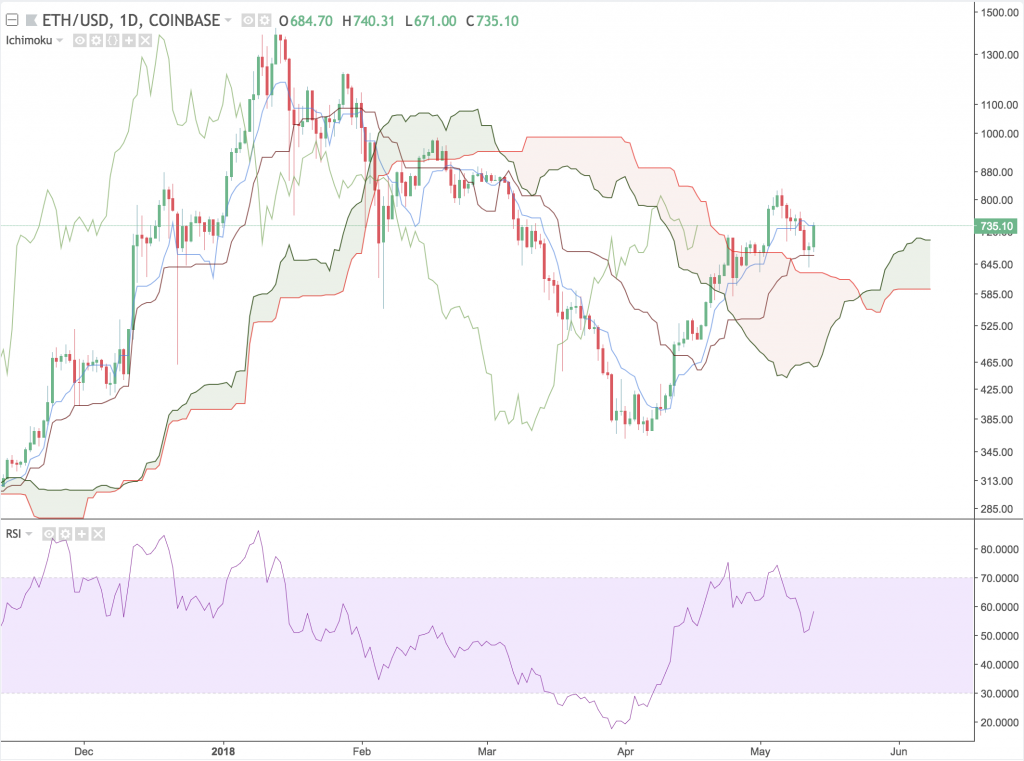
Ethereum is still above the cloud, which shows that its upward trend might not be over. The lagging span could be making an appearance soon with a cloud break. The other conditions for a valid cloud break are all met.
Ethereum's price is currently touching the Tenkan-Sen and bounced off the Kijun-Sen a few days back. Keep an eye out for how it reacts to the Tenkan-Sen for a possible trade opportunity.
Litecoin
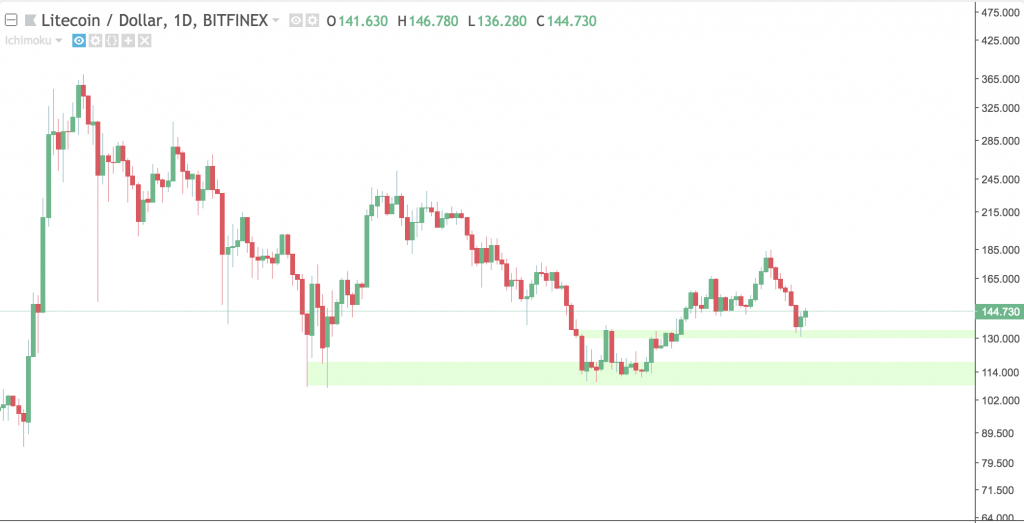
Looking at the 1D LTC/USD chart, we see that Litecoin also saw a pretty serious drop from $180 down to $130. It found support before the local support level that we highlighted last week and has bounced to its current price of $145.
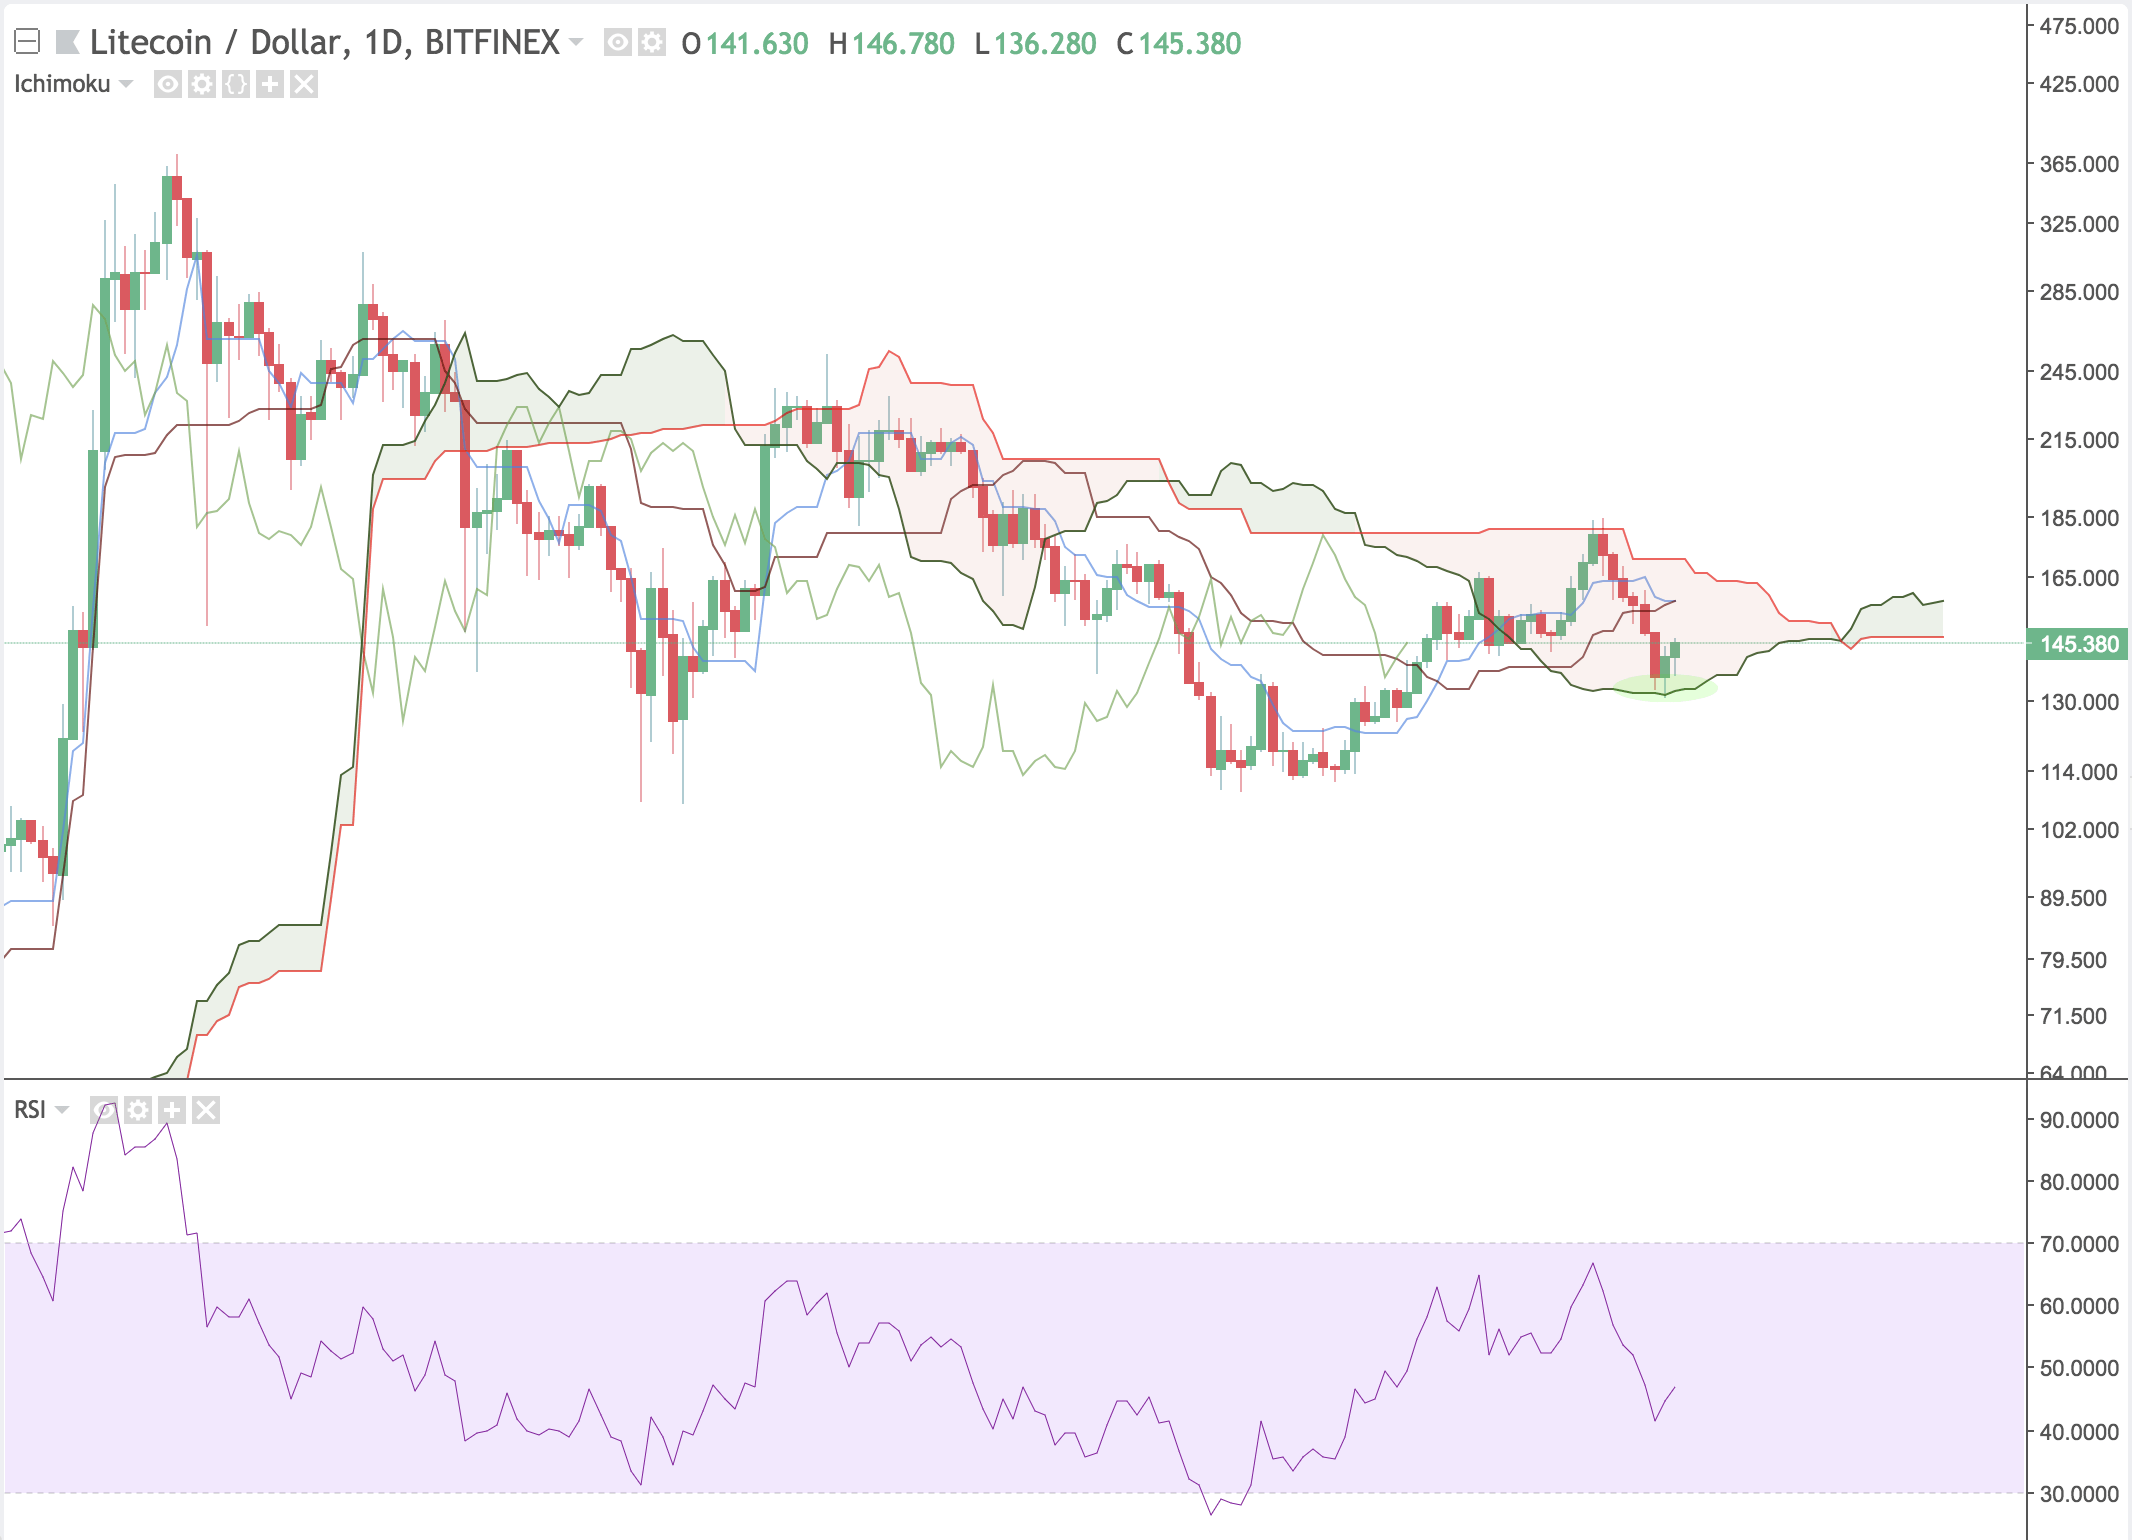
Adding Ichimoku Clouds to the chart, we start to see the bigger picture. It turns out, Litecoin's bounce off $130 was the exact bottom of the cloud. Litecoin is still inside the cloud and is headed towards the Tenkan-Sen and Kijun-Sen, which seem to be twisting bearish.
No major RSI indicators are there besides the bearish RSI divergence highlighted last week.
Bitcoin Cash
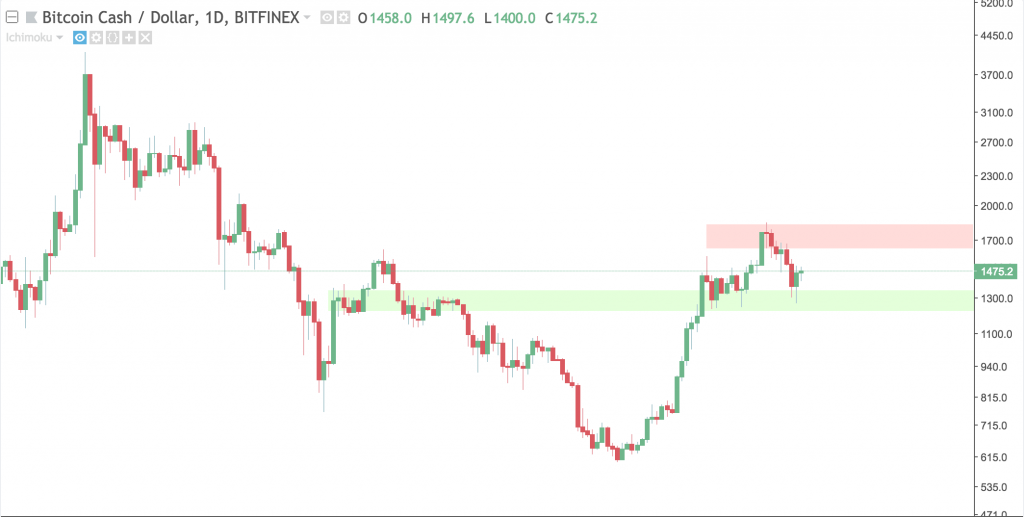
After being last weeks largest gainer, Bitcoin Cash saw one of the lowest drops of the group this week. It failed to break out of the resistance level highlighted last and seems to have found local support in the light green area.
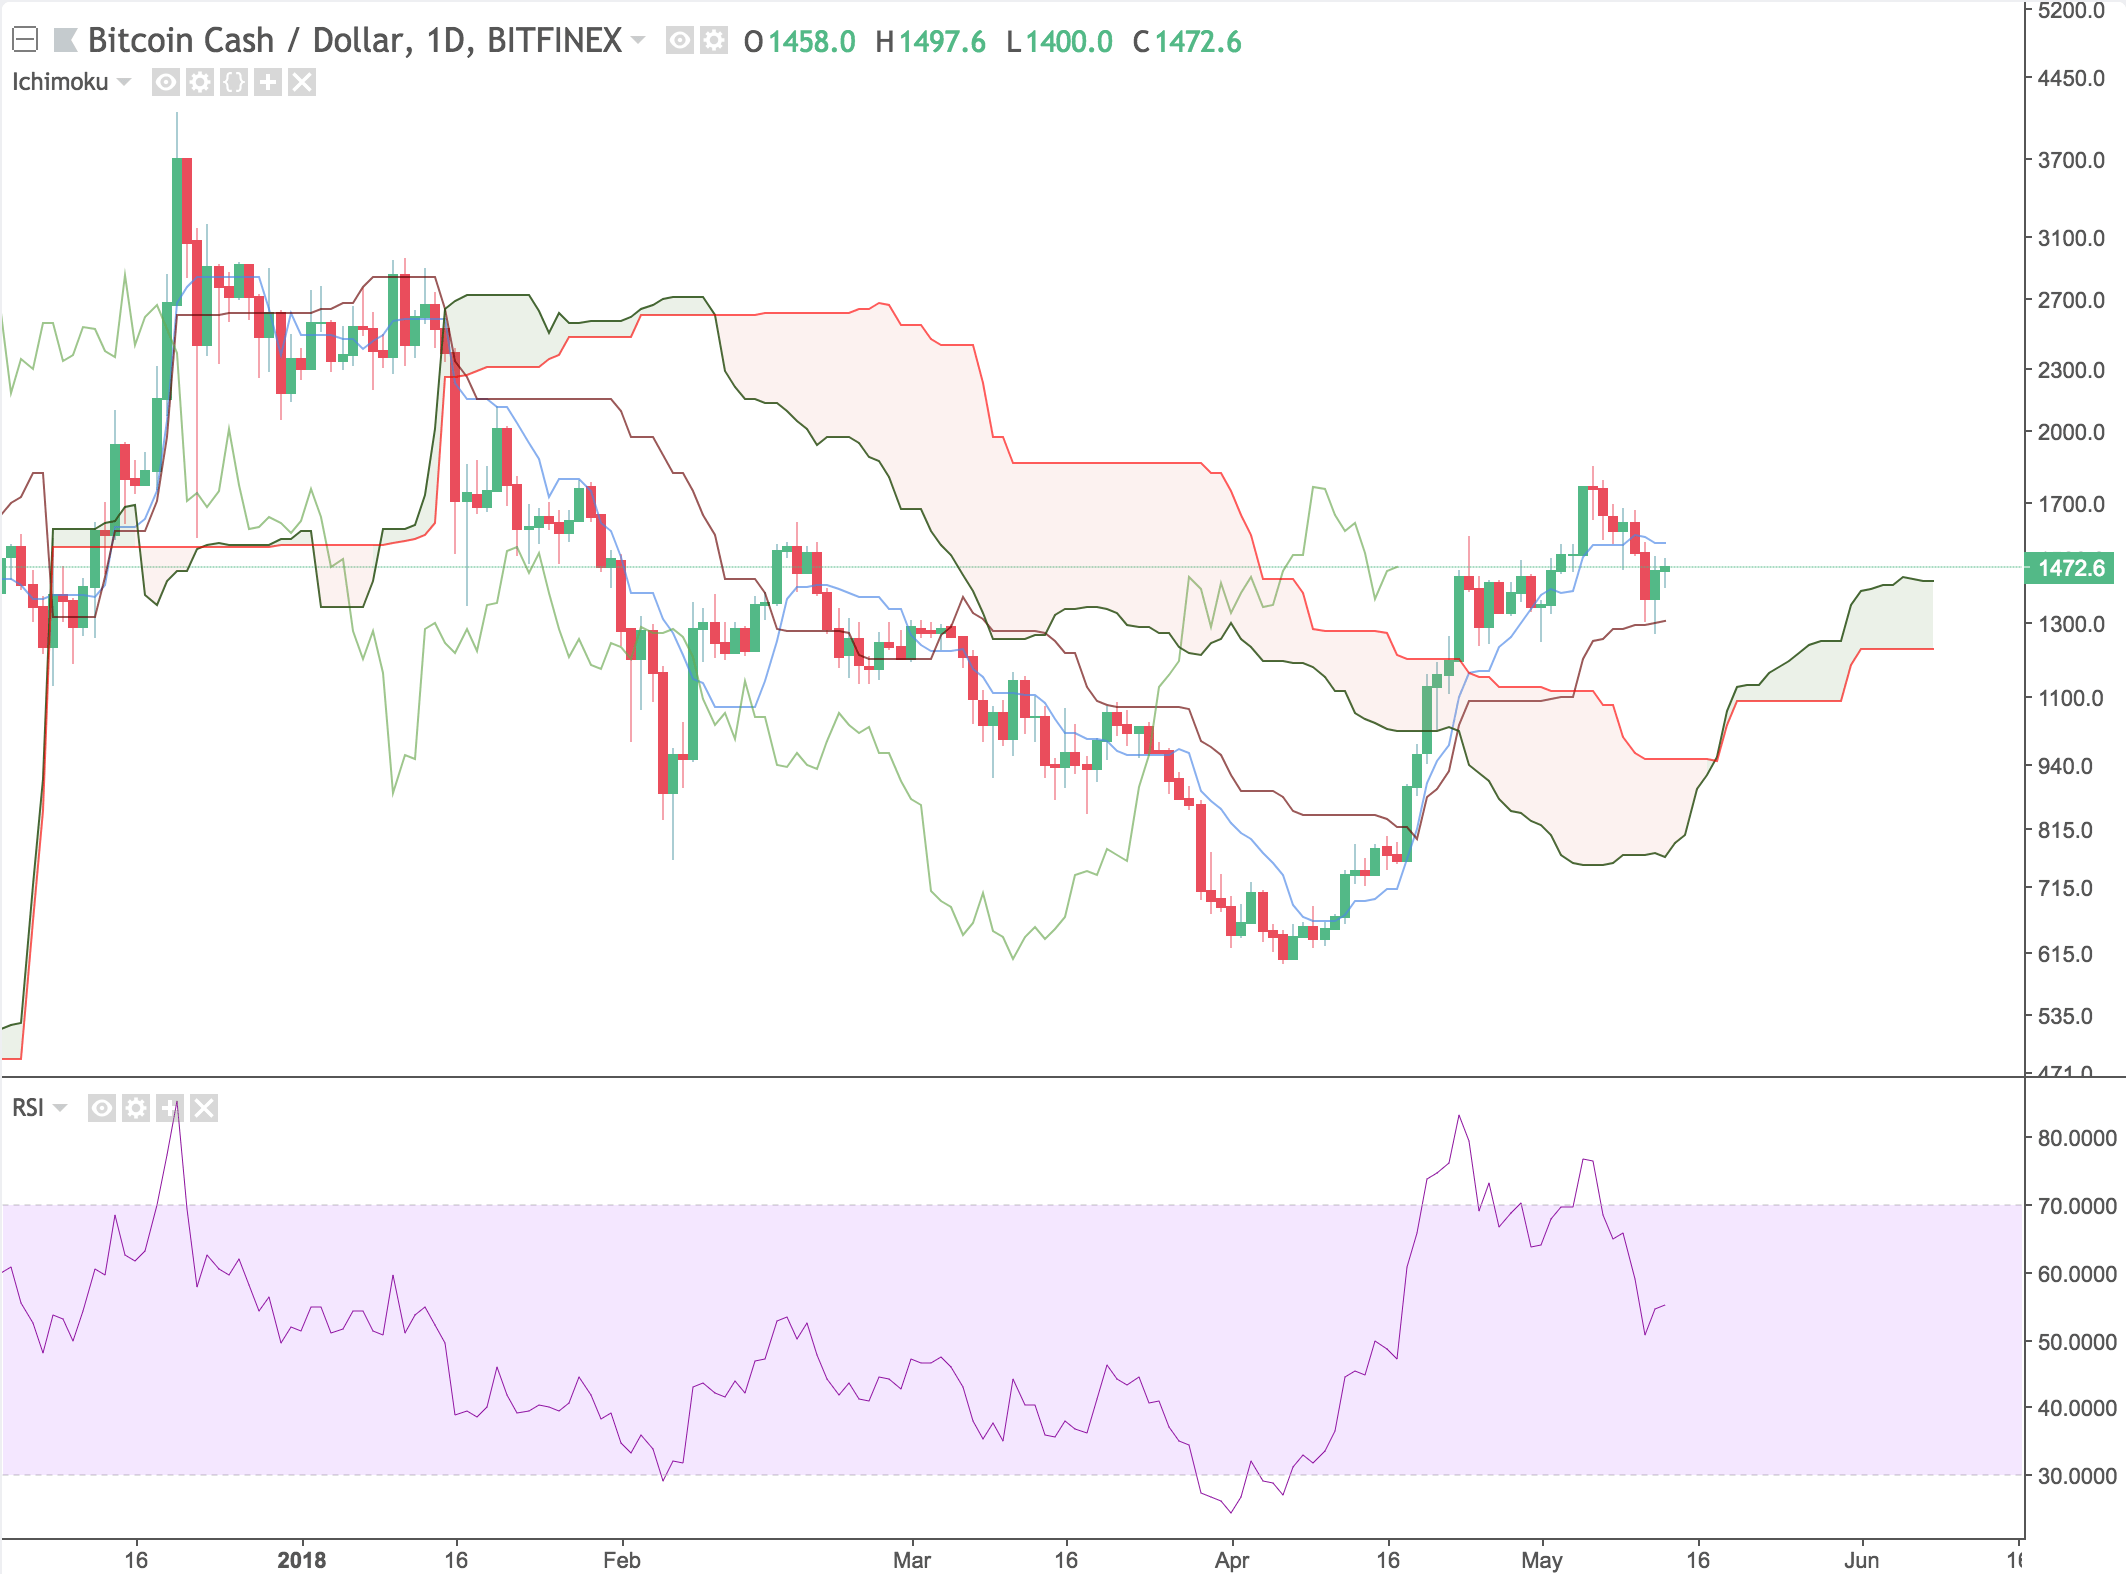
Bitcoin Cash bounced off the Tenkan-Sen and is floating between the Tenkan-Sen and Kijun-Sen. BCH recently experienced a cloud break and saw upside. The signals for an upward trend are still there, so given enough time, it will become more clear how to trade Bitcoin Cash.
Again, no Major RSI indicators are there besides the previous bearish RSI divergence.
Ripple
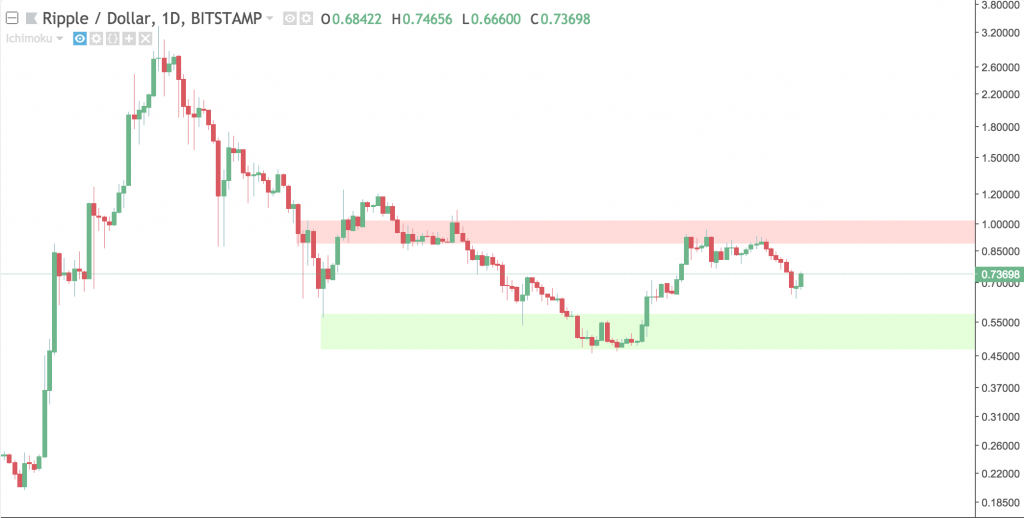
Ripple dropped from $0.90 and reached local support at $0.67. It currently is sitting at $0.74. Ripple is currently in a class action lawsuit revolving around Ripple potentially being an unregistered security. This case could have a serious impact on the price of Ripple, so we will be keeping an eye out for this over the next months.
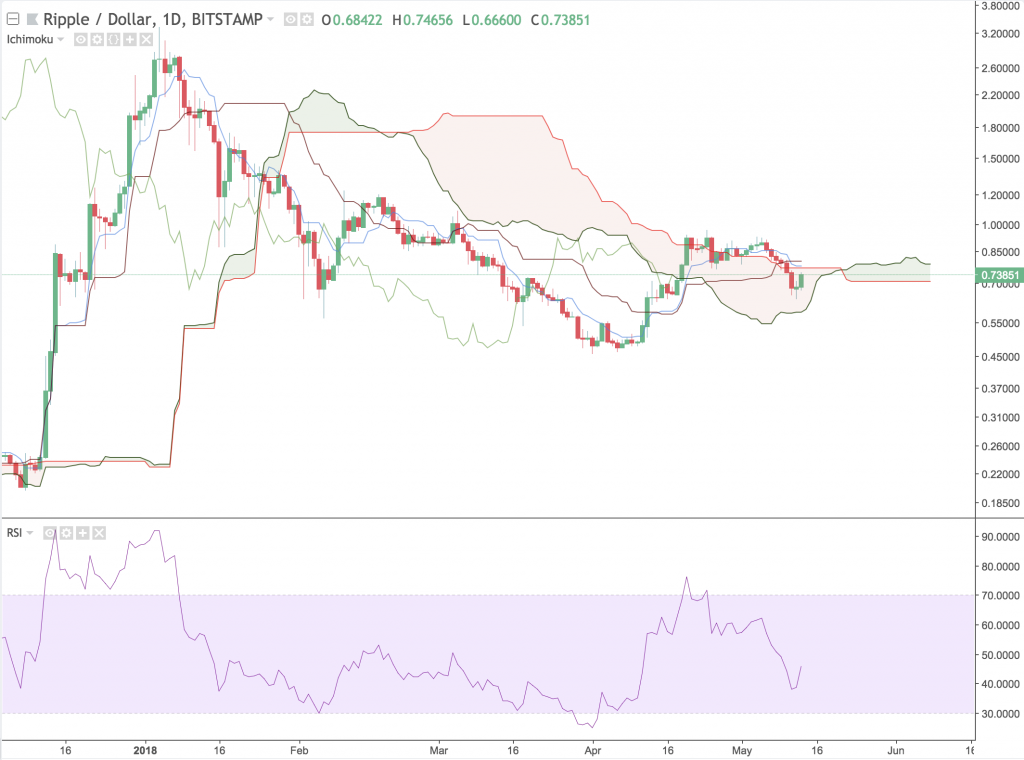
Using Ichimoku Clouds, we see a flat Kumo and a bearish TK Cross. Flat Kumo's are pretty strict resistance levels and usually act as price magnets. This is because if the top of the cloud is flat, then there is little to no trend over a time period. The TK cross that formed is not too significant as it occurred above the cloud in bullish territory.
Conclusions
After seeing such a large drop in a short period of time, there is a growing concern about the state of cryptocurrency markets. In the past, Consensus has done a lot for cryptocurrency leading to increases after the event.
#bitcoin and altcoins have rallied hard every Consensus event. Will this year continue the trend? $crypto $btc pic.twitter.com/KZm3AVKFCC
— Collin Crypto (@CollinCrypto) May 12, 2018
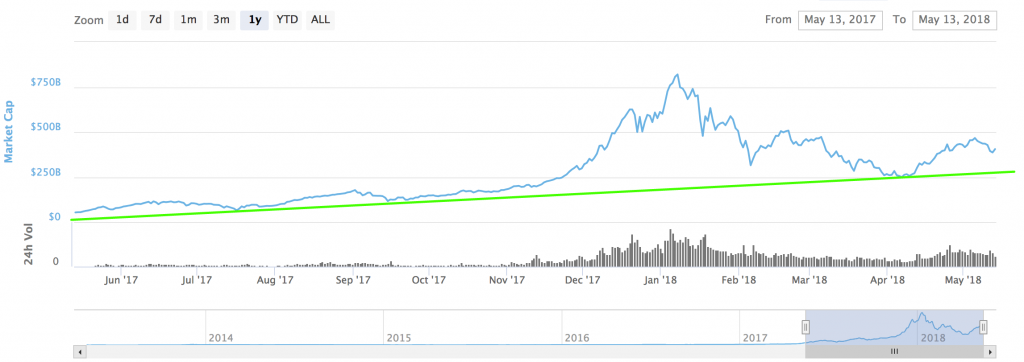
The overall market cap is still higher than the previous month, which supports the conservative upward trend line we have seen over the past year. The next few months should give a good idea of what the rest of the year will bring for cryptocurrency markets.
Technical analysis is a very useful tool for making educated guesses but is never a guarantee. Consider using a mix of both technical and fundamental analysis to increase your odds of success when trading.
Follow Austin on Twitter to see more cryptocurrency related content.
Glossary
Here are the definitions for each of the technical analysis terms used in this article.
- Senkou Span A – an indicator that is used to measure momentum, as well as future areas of support and resistance. Senkou Span A is always drawn in relation to Senkou Span B – together, they form the cloud.
- Senkou Span B – forms the cloud along with Senkou Span A. Traditionally when Senkou Span B is located below Senkou Span A, it is a symbol of bullish price movement.
- Senkou Span cross – The cloud is an area of uncertainty. Most traders do not make a move until price closes above or below the cloud – although, when the Senkou Spans cross one another, many traders use the indicator to predict the reversal of a current price trend.
- Kumo Twist – The Ichimoku Cloud is a Japanese trading strategy, and ‘Kumo’ means cloud in Japanese. The Kumo Twist is just a nickname for a Senkou Span cross.
- Tenkan-Sen – The Tenkan-Sen is used in conjunction with the Kijun-Sen to predict long and short positions. The formula for the Tenkan-Sen’s calculation takes the highest high and the lowest low and divides it by two over the last seven to eight time periods.
- Kijun-Sen – Similarly to the Tenkan-Sen, the Kijun-Sen is calculated using the same formula, but it usually includes the last 22 time periods. The Tenkan-Sen highlights short-term price movement, while the Kijun-Sen gives a better idea of long-term price movement.
- TK crossover – When the Tenkan-Sen crosses above the Kijun-Sen, it is an indication of bullish price movement. Conversely, the Tenkan-Sen crossing below the Kijun-Sen is a bearish sign. Both of these signals are known as a TK crossover. The location of the TK crossover impacts the strength of the signal. For example, a bullish TK crossover below the cloud is in bearish territory, and therefore a weak signal. On the other hand, a bullish TK crossover above the cloud is a strong signal.
- Chikou Span – Otherwise known as the Lagging Span, Chikou Span shows where the price was 26 periods before the most recent closing price. An upwards Lagging Span above price shows bullish momentum, while a Lagging Span below price shows bearish momentum.