


 Ethereum leverage ratio peaks at 0.48 amid price surge, declines with downturn
 On-chain Highlights
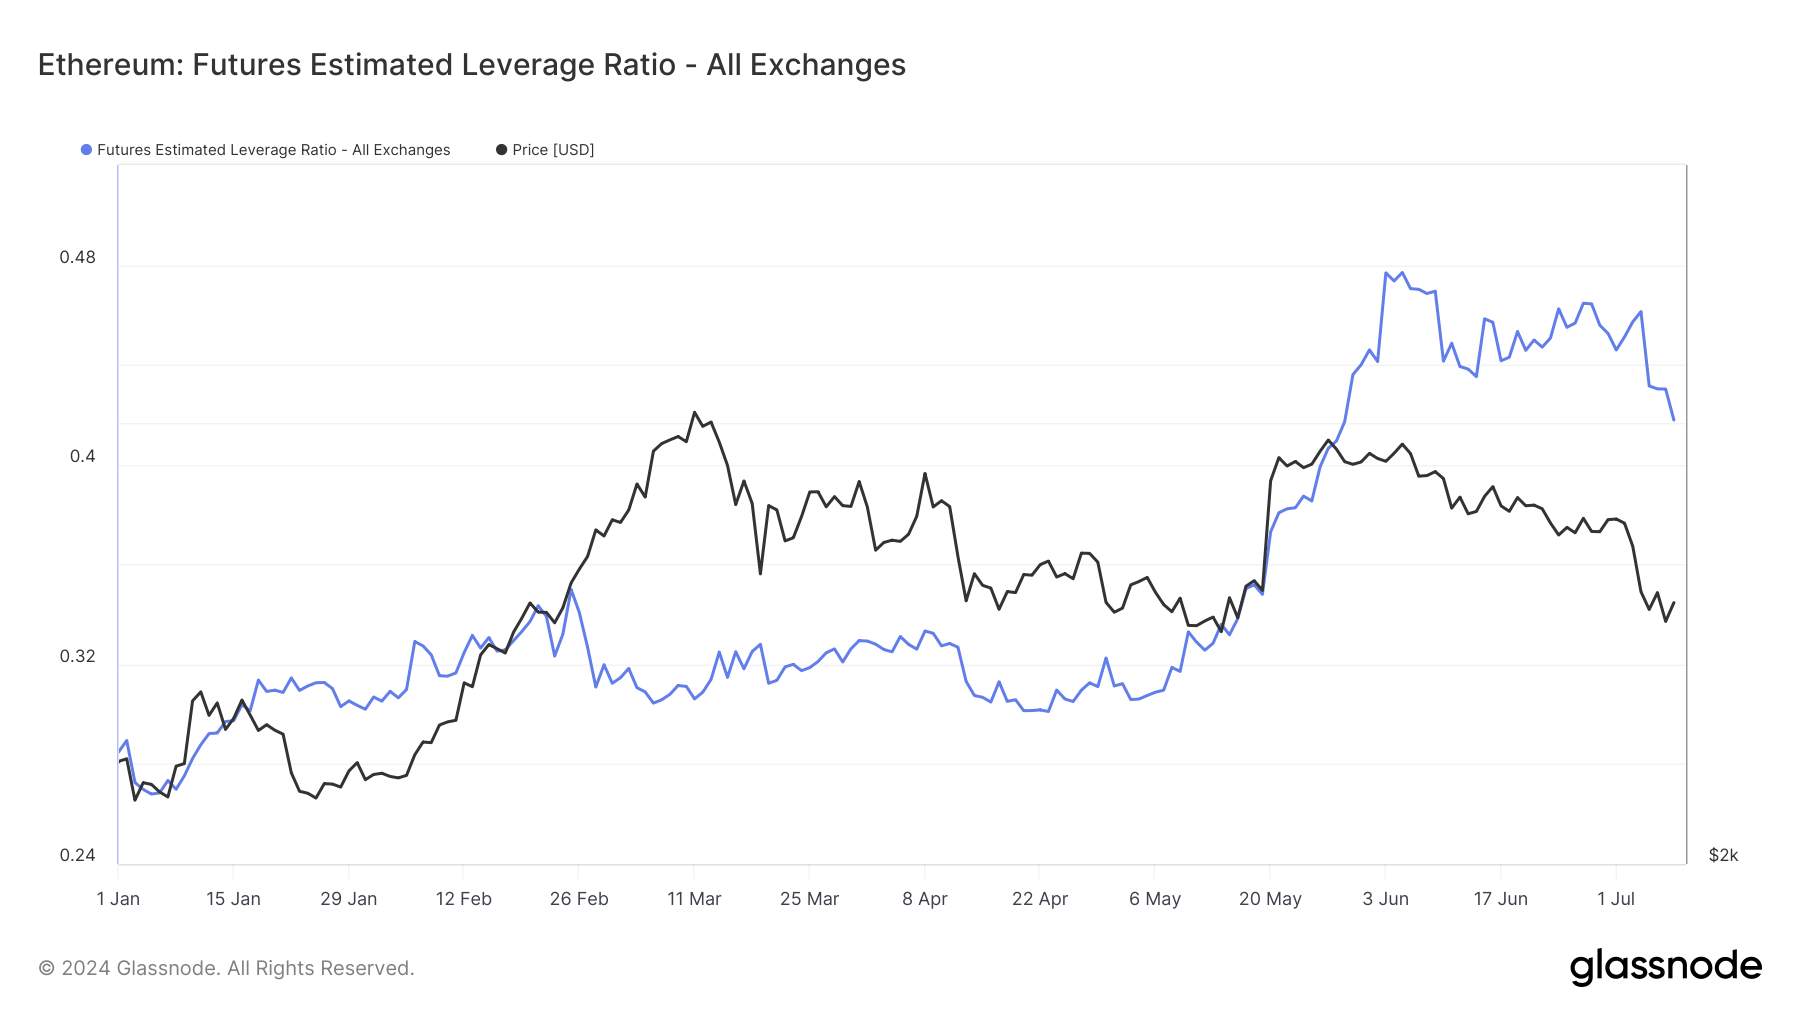
DEFINITION: The Estimated Leverage Ratio is defined as the ratio of the open interest in futures contracts and the balance of the corresponding exchange.
Ethereum’s Futures Estimated Leverage Ratio has shown notable fluctuations over recent months. Beginning the year around 0.26, the leverage ratio experienced a steady climb, peaking at approximately 0.34 in February.
This period coincided with a rise in Ethereum’s price, suggesting increased speculative activity and confidence in the market. However, as Ethereum’s price began to decline in April, the leverage ratio similarly decreased, reflecting a reduction in leveraged positions.
However, as Ethereum recovered again in late May, so did the leverage ratio. The ratio peaked at 0.48 in early June and has since retraced to around 0.42, mirroring the price decline to around $3,000.
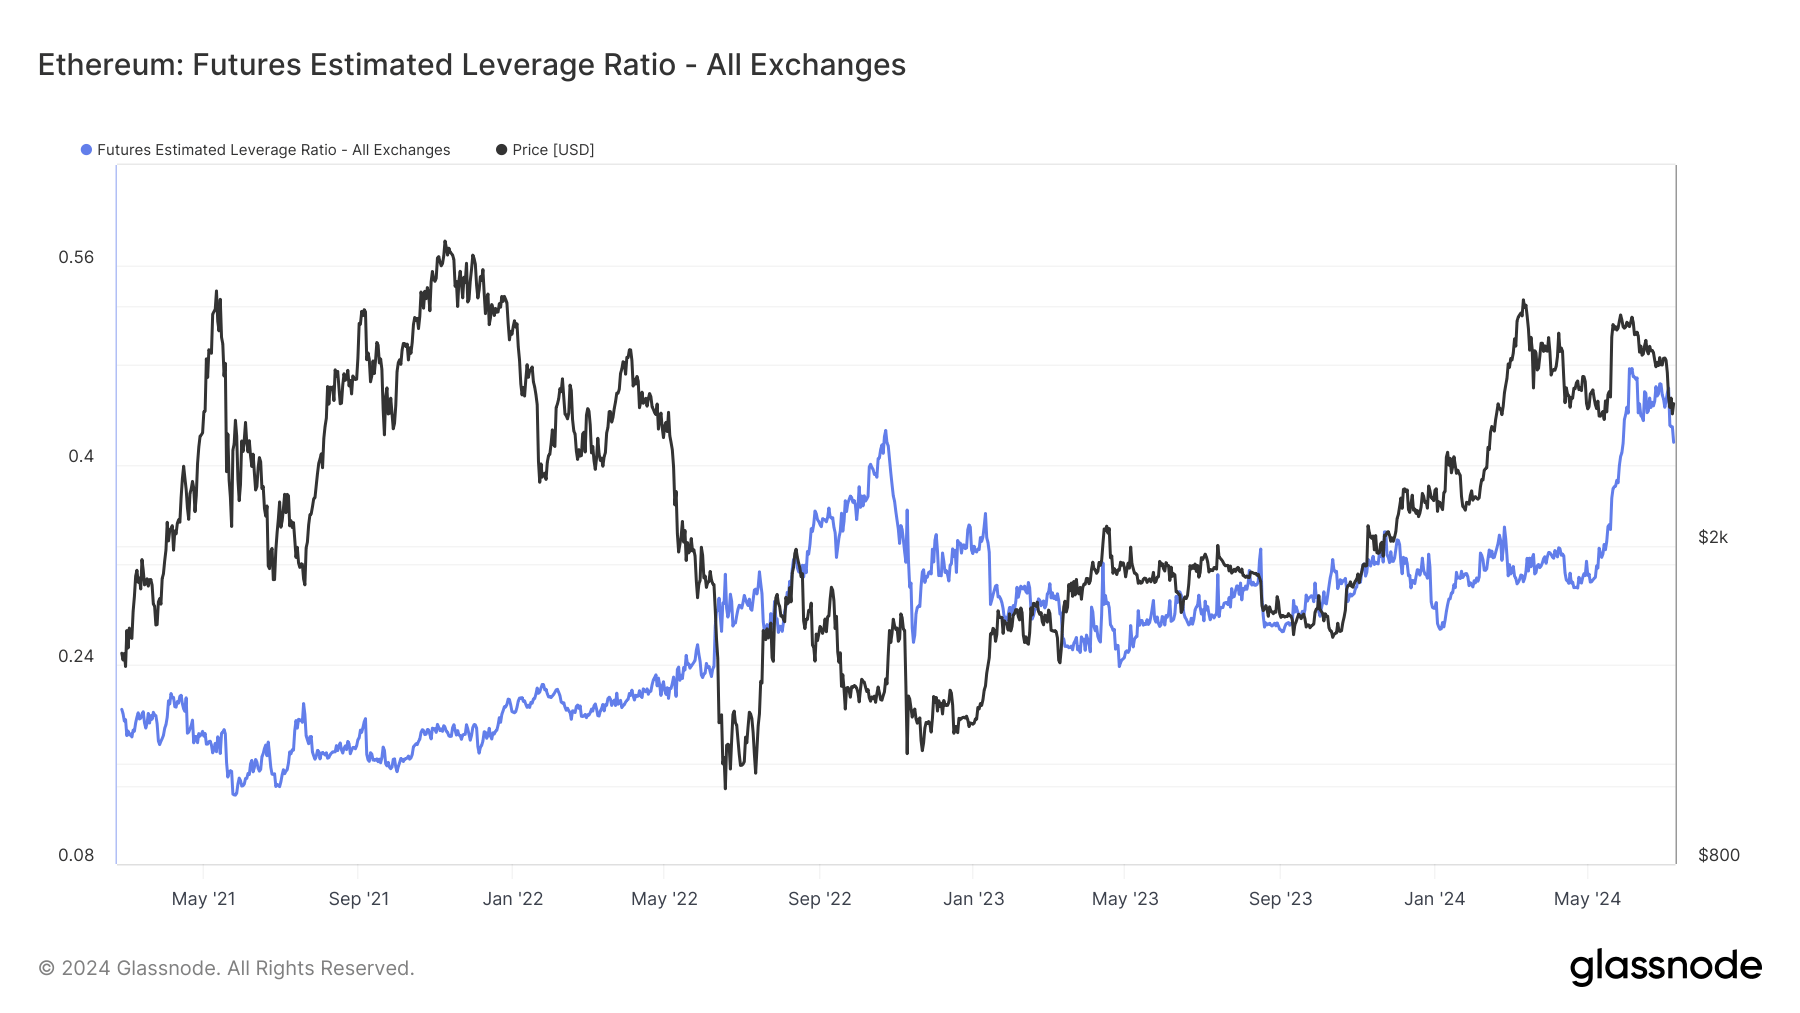
From a longer-term perspective, the leverage ratio’s movements since May 2021 illustrate a pattern of spikes aligning with price drops, followed by sharp rises during market corrections. Bucking the trend, the current surge during the price increase in 2024 marked the all-time high for the leverage ratio since Glassnode data began in 2021.
The recent downward trend in both the leverage ratio and Ethereum’s price since June 2024 may indicate a broader market cautiousness and deleveraging trend, likely influenced by macroeconomic factors and regulatory developments.
Latest Insights


In this insight
Ethereum is a decentralized, open-source blockchain platform that enables the creation of smart contracts and decentralized applications (DApps).
Featured Data Partner