 Facebook’s Libra sparks privacy concerns while Monero, Zcash, Zcoin and Grin surge
 Facebook’s Libra sparks privacy concerns while Monero, Zcash, Zcoin and Grin surge

Cover art/illustration via CryptoSlate. Image includes combined content which may include AI-generated content.
Facebook’s announcement of the Libra stablecoin raised privacy concerns. Whether it’s related or not, some of the top privacy coins spiked after the announcement, including Monero, Zcash, Zcoin, and Grin.
Monero
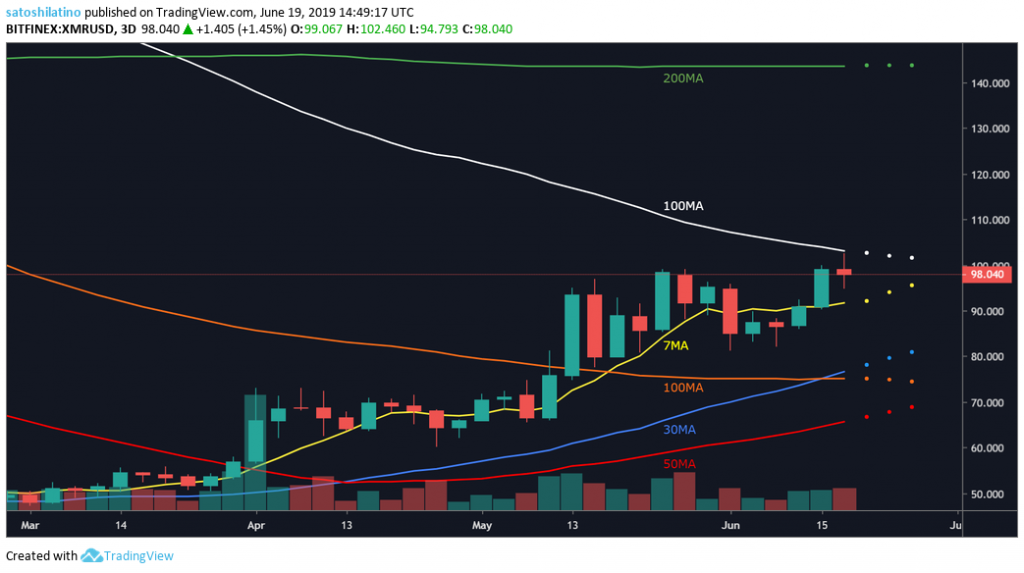
Monero is sitting at a pivotal point based on the 3-day chart. It is trading above the 7-three-day moving average, which is a positive sign, but it has not been able to break above the resistance given by the 100-three-day moving average.
Therefore, it will be wise for an investor to wait for a break above the 100-three-day MA, which could take it up to the 200-three-day MA—or a move below the 7-three-day MA that will take it down to test the 30-three-day MA.
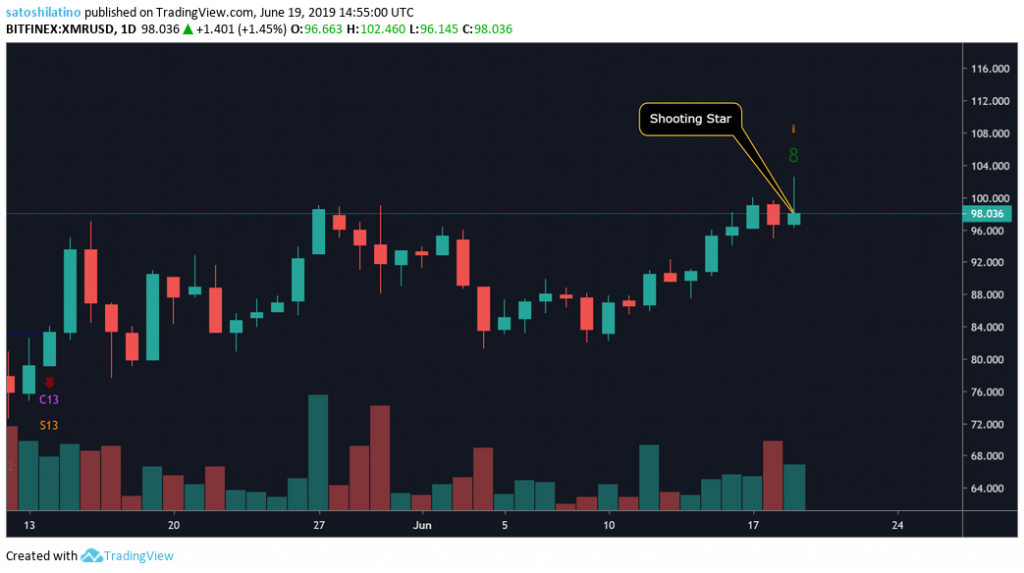
On the 1-day chart, the current candlestick is showing signs of a shooting star pattern. This is a bearish candlestick that appears after an uptrend and indicates that there is potential for XMR to retrace. According to the TD Sequential Indicator, Monero is on an eight green candle out of nine warning that a sell signal will come soon come adding credibility to the shooting star candlestick pattern.
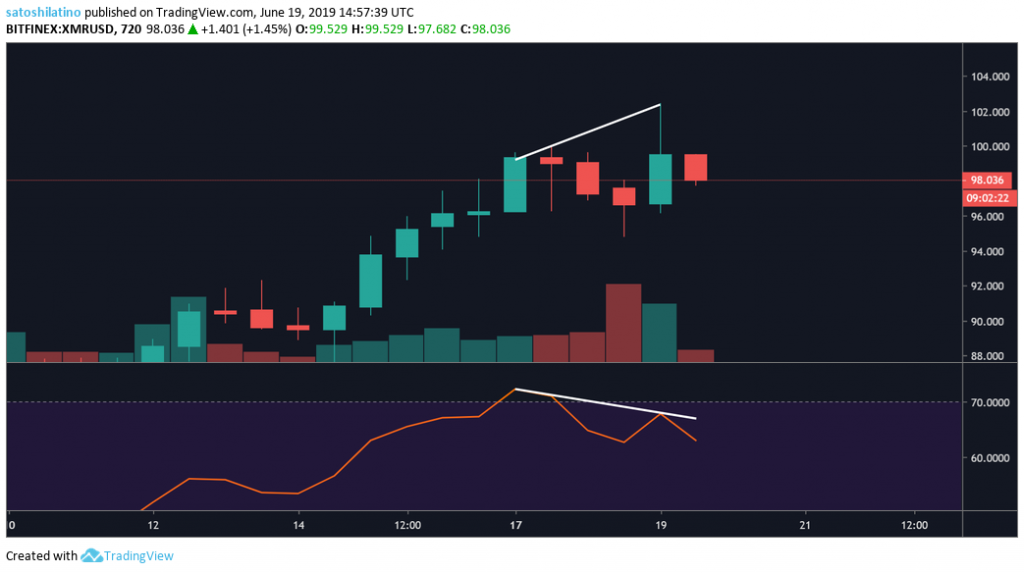
A bearish divergence can be spotted on the 12-hour chart since the price of Monero has been reaching higher highs while the Relative Strength Index has been making new lows. Although this bearish formation does not provide a precise selling point, it could be signaling that the bullish momentum that this cryptocurrency has gone through could soon change in direction.
Zcash
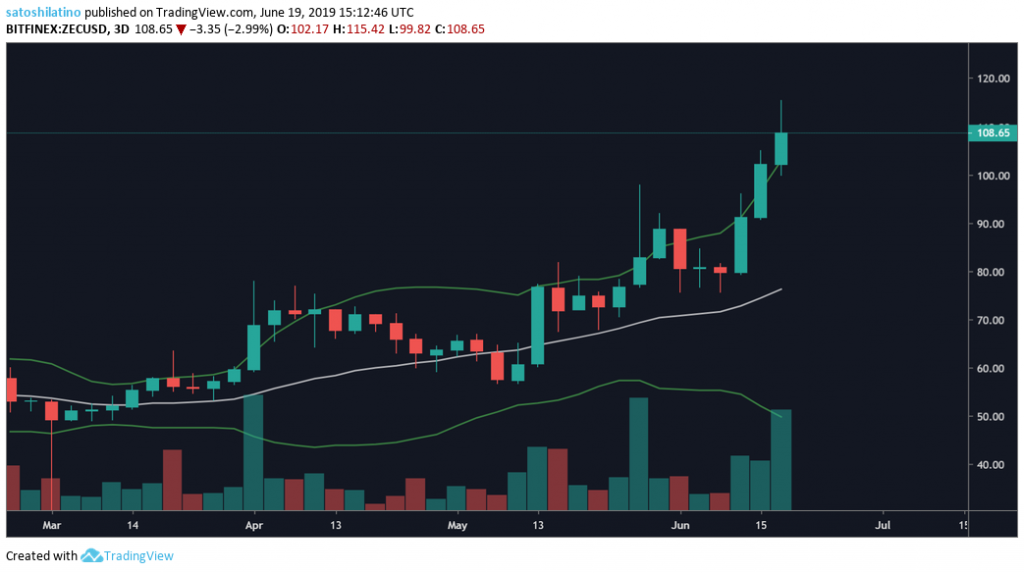
Zcash recently broken above the $100 milestone to reach a new yearly high of $115.5. The upswing was noticed by Barry Silbert, the founder and CEO of Digital Currency Group, who believes that privacy cryptocurrencies are “growing in appeal.”
Privacy-focused digital currencies, like $ZEC and $ZEN, are quickly growing in appeal
— Barry Silbert (@barrysilbert) June 18, 2019
Based on the 3-day chart, ZEC climbed above the upper Bollinger Band, which could act as a support for the following days as it reaches higher highs.
Nonetheless, a break below support could trigger a pullback to the middle band (20-three-days moving average).
Support and resistance levels are based on historical data that help identify the price points that act as barriers in bearish or bullish moves, pausing the continuation of a trend due to unusually high supply or demand.
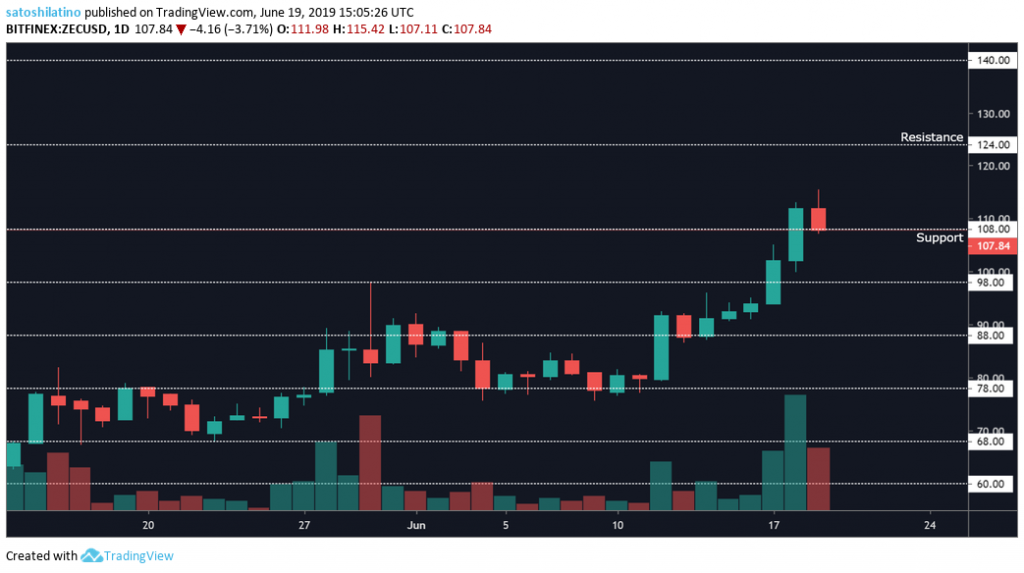
Zcash appears to be trading around the $108 support level on the 1-day chart. If this cryptocurrency continues the steady rise that began on June 12, it could try to test the $124 resistance level or even the $140 one. Breaking below the current level of support could set ZEC back to $98.
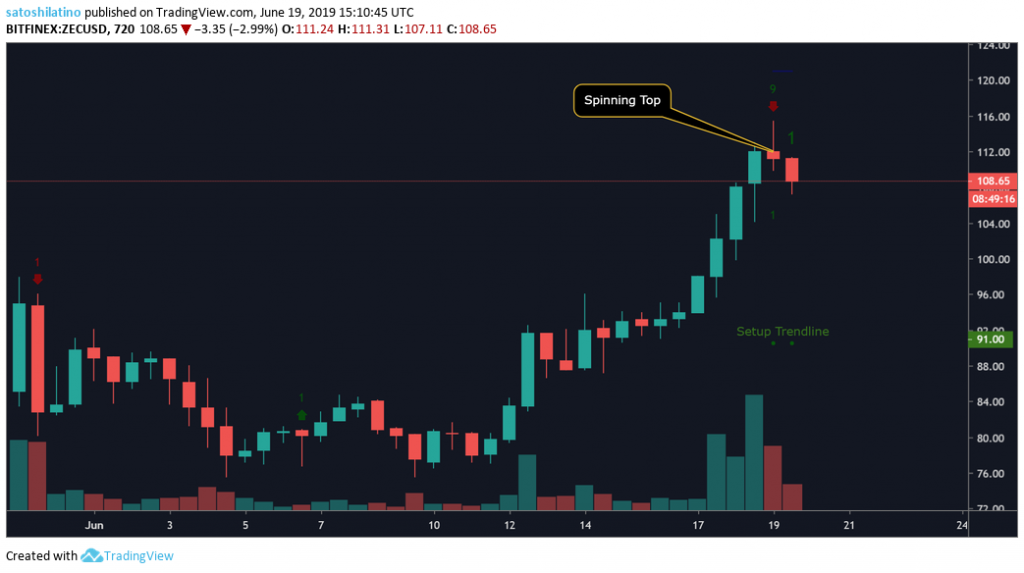
A spinning top candlestick formed on Zcash 12-hour chart. This is a clear sign of indecision that could predict an upcoming reversal. Since it occurred on a green nine candlestick based on the TD Sequential Indicator, it strengthens the probabilities for a correction, which could take it down to the setup trendline at $91.
Zcoin
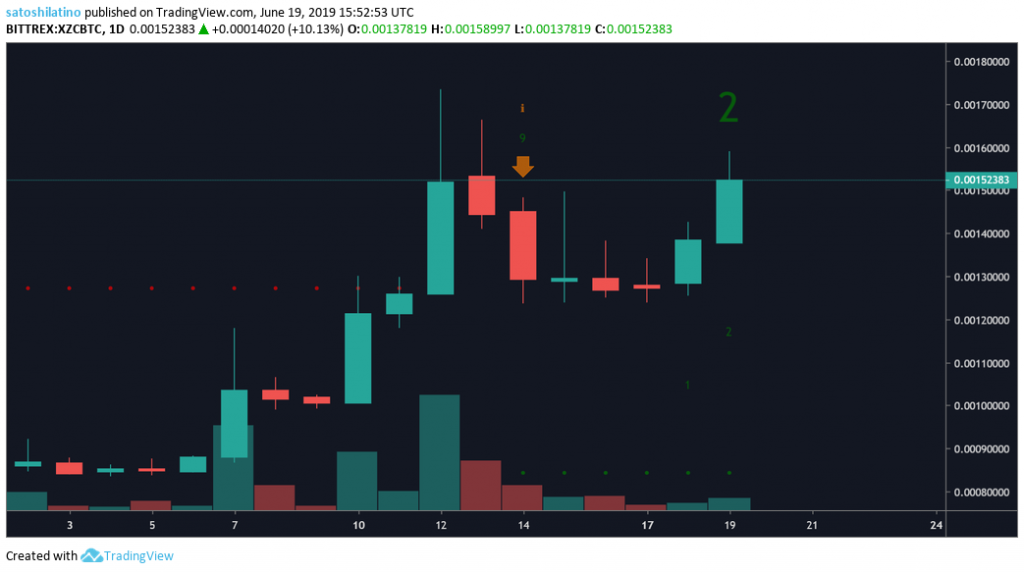
Following the sell signal given by the TD Sequential Indicator with a green nine, Zcoin went through a 12 days consolidation period to then finally breakout.
This technical index maintains that a buy signal is triggered once a green two candlestick starts trading above the previous green one candle, which is exactly what happened on XZC’s 3-day chart. The continuation of the bullish trend will be confirmed once this cryptocurrency is able to trade above the recent high of 175,000 satoshis.
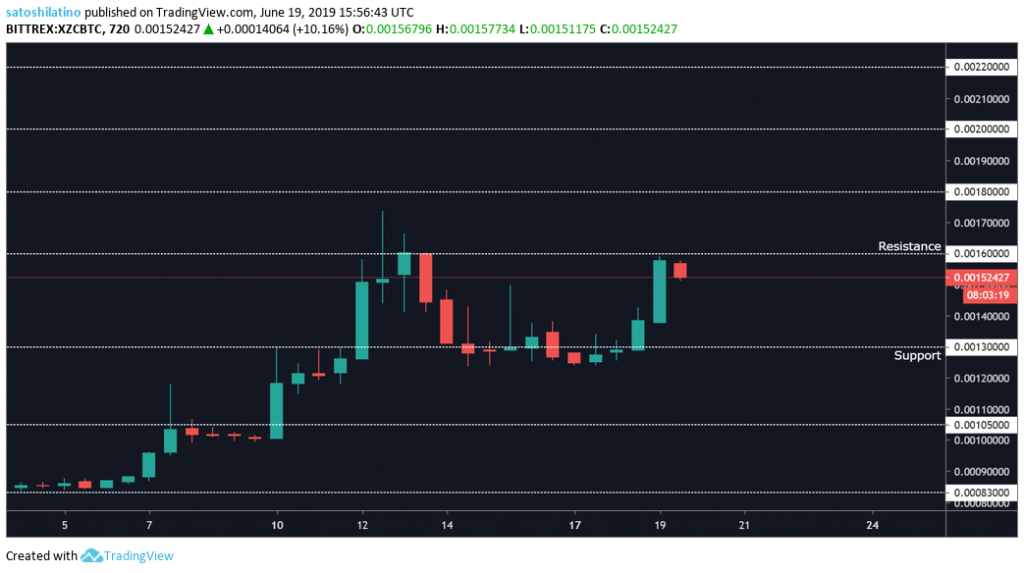
Zcoin is once again testing the 160,000 satoshis level of resistance based on the 1-day chart. A move above this barrier could take it up to the next resistance levels at 180,000, 200,000 or even 220,000 satoshis.
Nonetheless, the amount of time XZC has been trading between the 130,000 satoshis support and the 160,000 satoshis resistance may indicate a retrace to the support level before breaking above resistance.
Grin
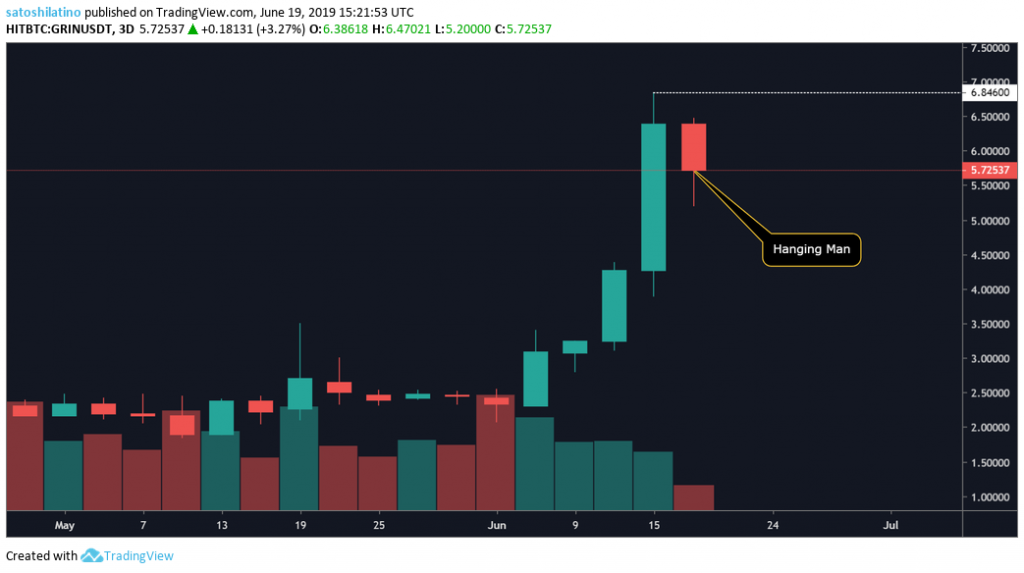
Since early June, Grin surged more than 230 percent. From $2.10 on June 5up to $6.85 on June 17.
Now, a hanging man candlestick pattern is forming on the 3-day chart. This is a bearish formation that shows that selling interest is starting to increase, but in order for it to be validated, the following candlestick must push the price further down.
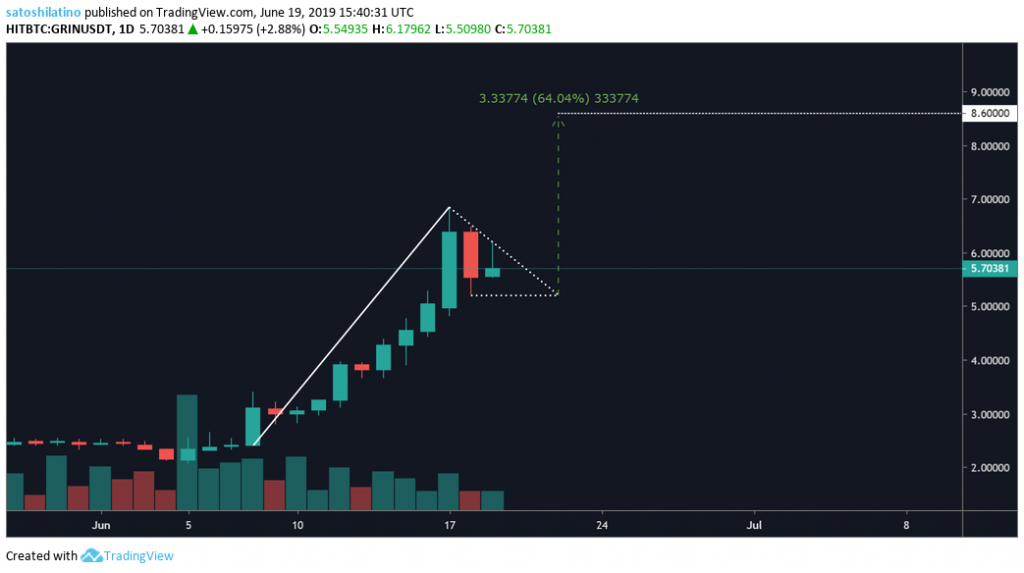
Although it is too early to tell, a bull pennant could be developing on the 1-day chart. This is a continuation pattern that is formed after a significant increase in the market valuation, known as the flagpole, and is followed by a consolidation period that tends to breakout in the same direction as the initial price movement.
If the bull pennant is validated, GRIN could rise another 64 percent to reach a new high of $8.6.
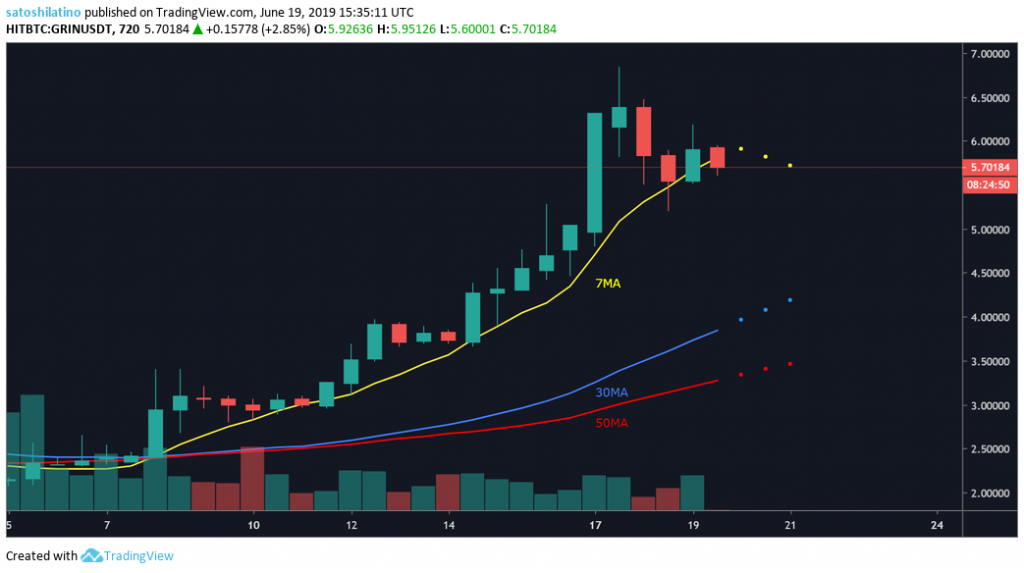
The support given by the 7-twelve-hour moving average on the 12-hour chart appears to be losing its strength and could no longer hold the price of GRIN.
If this cryptocurrency moves below the 7-twelve-hour MA, it could try to test the next support levels that are given by the 30 and the 50-twelve-hour MA.
Overall Sentiment
Following the recent upswing that all of the privacy coins previously analyzed have had, it seems like they could be about to retrace before the continuation of the bullish trend. Although the pullback could be short-lived, it is probably going to be steep considering the magnitude of the upwards move.


 Farside Investors


 CoinGlass


