These are the key levels to watch following Bitcoin’s insane flash crash

Cover art/illustration via CryptoSlate. Image includes combined content which may include the use of AI tools.
Yesterday, investors witnessed one of Bitcoin’s largest-ever hourly price declines, with the benchmark cryptocurrency plummeting from highs of $10,200 to lows of $9,200, which is where BTC was able to find some intense buying pressure that helped climb to its current price of $9,600.
This sharp and sudden decline muddied the clarity that many investors had regarding where Bitcoin is heading next, and analysts are now closely watching to see how BTC reacts to a few key support levels in the near-term.
Furthermore, one key set of data also seems to indicate that $9,800 is a key resistance level for the cryptocurrency, with a break above this opening the gates for significantly further upside.
Bitcoin remains above key support levels, but a further downside could spark a massive selloff
At the time of writing, Bitcoin is trading down just over five percent at its current price of $9,600, which is around where it has been trading at in the time since it bounced from intra-crash lows of $9,200.
Bitcoin's ability to maintain stable at this level seems to bolster bulls, as it shows that they have enough strength to defend a few critical support levels that lie just a hair below its current price region.
Josh Rager, a prominent cryptocurrency analyst on Twitter, spoke about these support levels in a recent tweet, explaining that the first area of interest he is watching exists at $9,300.
“You should be aware of potential price-levels if the BTC pullback continues. Areas of interest include: $9300 – $8600 to $8700 – $7900 to $8200. Since May 2019, the most buying/selling volume occurred between $7900 to $8200. With $8200 being a key horizontal support on weekly chart.”
This data shows $9,800 is now a critical resistance level
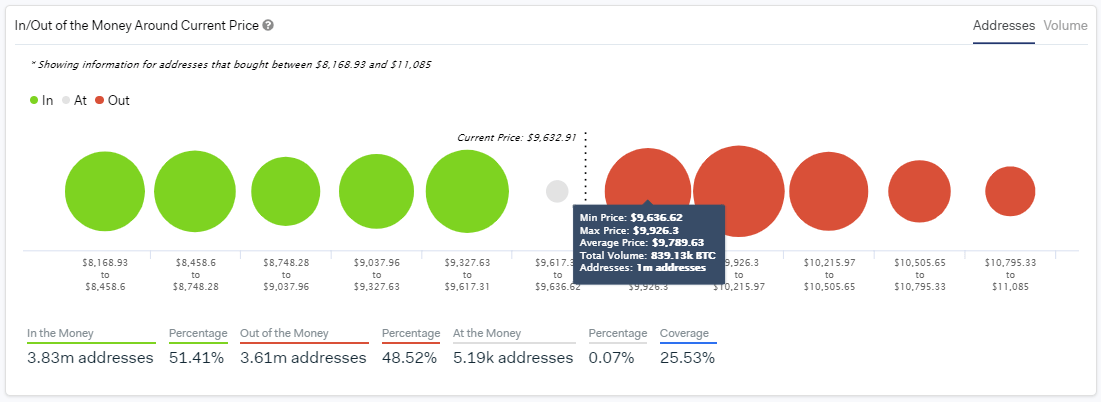
As for where Bitcoin’s key near-term resistance is, data from blockchain analytics firm IntoTheBlock elucidates that there are one million BTC wallet addresses with positions around $9,800 – meaning that investors who bought the crypto at this price could be looking to break even.
“A look at the IOMAP model for Bitcoin shows 1m addresses with positions around the $9800 mark. This could be seen as the level of resistance for $BTC to get to $10,000.00 as a percentage of investors that previously bought at this price may be looking to break-even.”
How Bitcoin’s current bout of sideways trading resolves, and which of these levels is tested first, should provide insights into where the aggregated market is heading next.