Tezos (XTZ) made it back into the top 10 cryptos by market cap; what’s next?
Cover art/illustration via CryptoSlate. Image includes combined content which may include the use of AI tools.
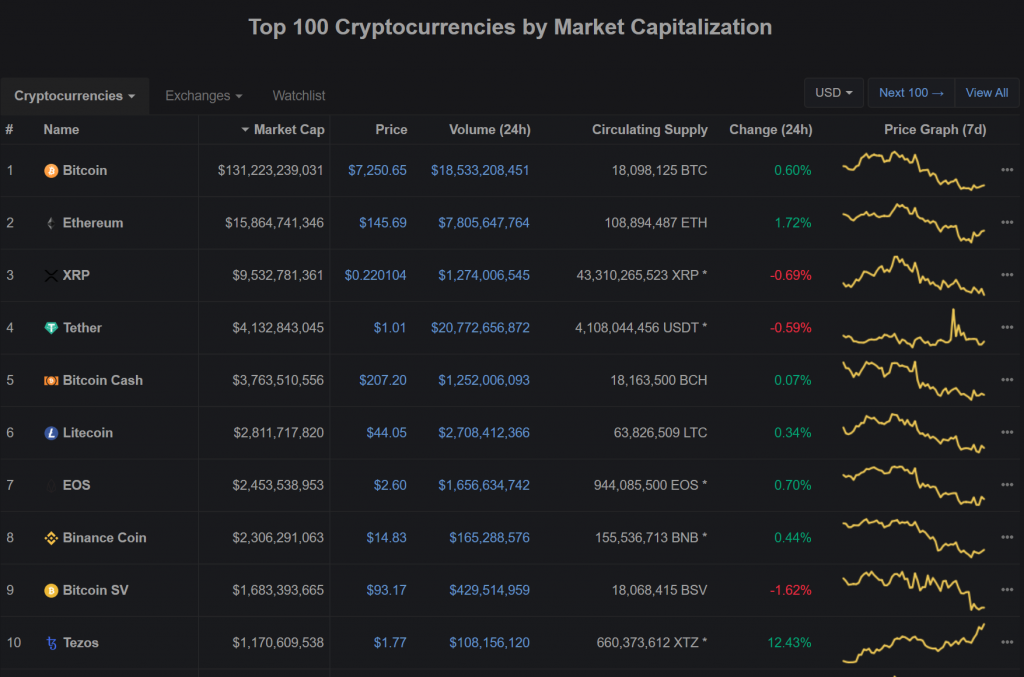
Over the past 24 hours, Tezos moved back into the top 10 cryptos by market cap, according to CoinMarketCap. Now, based on technical analysis, it seems that XTZ could be preparing to retrace before it continues an uptrend.
Tezos technical analysis
Within the last eight weeks, Tezos surged nearly 147 percent to recently hit a high of $1.84. The exponential upward momentum got it to break above a bull flag that was forming since the beginning of the year.
The 360 percent rally that took place between March and May created the flagpole. And, the descending parallel channel that developed in mid-May formed the flag. At the moment, XTZ is in the breakout stage of this bullish formation, which estimates a move up to $2.42. This target is determined by measuring the height of the flagpole.

Despite the bullish outlook, XTZ could soon find an exhaustion point based on the TD sequential indicator. This technical index is presenting a sell signal in the form of a red nine on Tezos’ 1-day chart.
The bearish signal estimates a one to four candlesticks correction or the beginning of a new downward countdown. A red two candlestick trading below a preceding red one candle would validate the pessimistic view.
It is worth noting that Tezos is currently fighting the significant level of resistance presented by the 100 percent Fibonacci retracement level. This price hurdle was able to reject the price of XTZ back in May. And, in combination with the sell signal given by the TD sequential indicator, it could prevent this cryptocurrency from rising higher once again.
A spike in the selling pressure behind XTZ could push it downwards to test the support given by the 78.6 percent Fibonacci retracement level at $1.52. Breaking below it could ignite a further sell-off that takes this crypto to the 65 percent Fibonacci retracement level at $1.31.
Conversely, closing above the 100 percent Fibonacci retracement level may imply that the bullish impulse seen behind XTZ would continue. The next levels of support are around the 113 and 127.2 percent Fibonacci retracement levels sitting at $2.05 and $2.27, respectively.
Overall sentiment
Tezos is facing significant resistance ahead. Based on a number of technical patterns, it seems like this cryptocurrency is bound for a correction before continuing its bullish trend. Nevertheless, a spike in volume may have the potential to invalidate the bearish signals and push Tezos into higher highs.