Cover art/illustration via CryptoSlate. Image includes combined content which may include AI-generated content.
Bitcoin just moved below $9,000 and is bringing the rest of the market down with it. Over the last 40 hours, Ethereum plunged over 6 percent, while XRP plummeted nearly 14 percent. The following technical analysis will evaluate where these three cryptocurrencies could be heading next.
Bitcoin (BTC)
Bitcoin has been consolidating within a descending parallel channel since June. 26. Since then, every time this cryptocurrency reaches the bottom of the channel, it bounces off to the middle or the top. But, when it reaches the top, it falls back to the middle or the bottom.
At the moment, BTC is retracing after hitting the top of the channel. A move down to the middle or the bottom of the channel could now be expected, as it has happened in the last four months.
Adding to the bearishness, the moving average convergence divergence (MACD), which is commonly used to follow the path of a trend and calculate its momentum, appears to be turning bearish. As the 26-day exponential moving average crosses over the 12-day exponential moving average, the probability for a downward movement increases.
As a result, Bitcoin is going down to test the support given by the 50-day moving average, which is sitting around $8,600. This is the same area where the 50 percent Fibonacci retracement level and the middle line of the descending parallel channel sit. Consequently, the zone between $8,600 and $8,100 poses a significant amount of support that could hold the price of BTC from a further correction.
This area could serve as a rebound point for Bitcoin that takes it to test the top of the descending parallel channel once again. But, an increase in the selling pressure behind BTC could prolong the consolidation period and trigger a move down to the bottom of the channel that sits at $6,900.
Despite the bearish outlook, Bitcoin remains bullish on the long-term perspective. A bull flag has been developing on its 3-day chart since late March. This is considered a continuation pattern that formed after Bitcoin surged to nearly $14,000, known as the flagpole, and was succeeded by the current consolidation period, known as the flag, which could result in a breakout in the same direction of the previous trend.
Ethereum (ETH)
Based on its 3-day chart, Ethereum appears to have formed a double bottom or “W” pattern around the 75 percent Fibonacci retracement level. This technical formation developed as Ethereum plummeted to $153 on Sept. 26, surged to $198 on Oct. 11, and then pulled back again to $153 on Oct. 23. While ETH's price behavior formed a “W” shape, the double bottom estimates a change in trend and momentum from bearish to bullish.
Despite the optimistic view, ETH is consolidating since late October between $180 and $192. Thus, this area can be considered a no-trade zone. Breaking outside of this trading range will determine where Ethereum is heading next.
On the downside, this crypto could plunge to $168 or $157 if it closes below $180. But, a spike in volume could take Ethereum to surge above $192 targetting a move to $207 or even to the 50 percent Fibonacci retracement level that sits at $223.
CryptoSlate Daily Brief
Daily signals, zero noise.
Market-moving headlines and context delivered every morning in one tight read.
5-minute digest 100k+ readers
Free. No spam. Unsubscribe any time.
Whoops, looks like there was a problem. Please try again.
You’re subscribed. Welcome aboard.
XRP
XRP is trending down despite the expectations that Ripple’s Swell generated. Based on its 3-day chart, the TD sequential indicator gave a sell signal on Oct. 28 that now seems to have been validated.
At the moment, XRP is being held by the 30-three-day moving average. Closing below this support level could ignite a sell-off that takes this cryptocurrency down to the next support levels that sit at $0.26, $0.25, and $0.24.
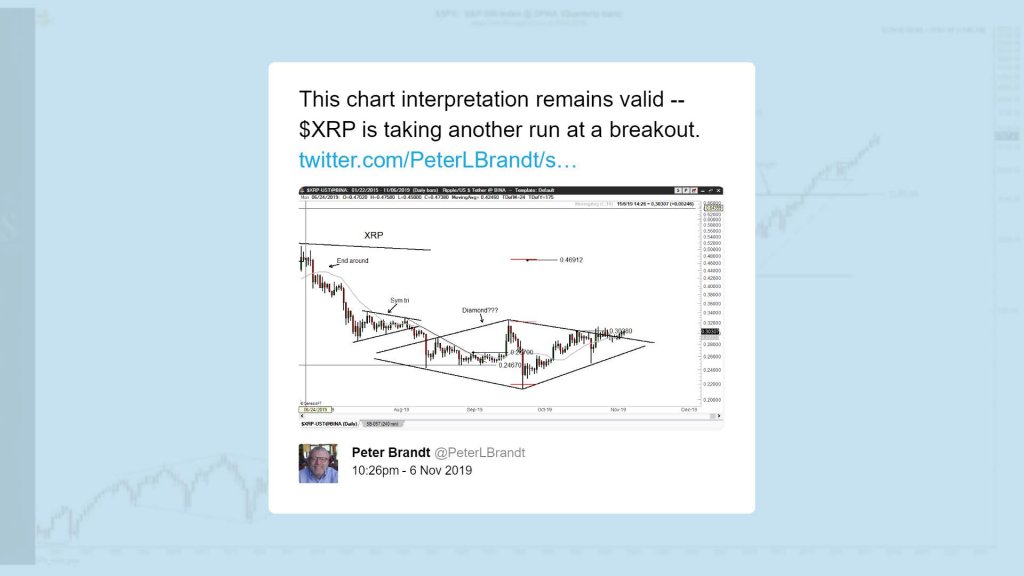
Nevertheless, 40-year trading veteran Peter Brandt recently stated that a diamond bottom pattern seems to be forming in XRP’s daily chart. Diamond bottoms are reversal patterns that are not common on traditional assets but are usually effective in the crypto market. Brandt estimates that if XRP is able to close above $0.30, it could shoot up more than 50 percent to $0.47.
Overall Sentiment
In the short-term perspective, the sentiment around the market is bearish. As Bitcoin moved below $9,000 without being able to finally break out of the consolidation phase it entered since four months ago, the odds for a pullback to $6,900 are growing. The same happens with Ethereum, which could retrace to $157 if the selling pressure behind it increases. And, XRP is showing signs of a move down to $0.24.
However, when looking at the market from a long-term perspective, everything looks bullish. Bitcoin is forming a bull flag that could lead to a 70 percent upswing to $16,500. Ethereum is developing a double bottom pattern targetting $223. And, XRP is in a diamond bottom pattern that could take it to $0.47, as Peter Brandt explained.
Bitcoin Market Data
At the time of press 7:39 pm UTC on Nov. 8, 2019, Bitcoin is ranked #1 by market cap and the price is down 4.36% over the past 24 hours. Bitcoin has a market capitalization of $159.57 billion with a 24-hour trading volume of $24.54 billion. Learn more about Bitcoin ›
At the time of press 7:39 pm UTC on Nov. 8, 2019, the total crypto market is valued at at $239.66 billion with a 24-hour volume of $83.29 billion. Bitcoin dominance is currently at 66.57%. Learn more about the crypto market ›