


How Bitcoin’s road to new ATH was reflected in on-chain data
CryptoSlate's latest market report dives deep into on-chain data to better understand the market forces leading up to, during, and after Bitcoin's journey to the new ATH.
Introduction
In an extraordinary demonstration of market resilience and investor sentiment, Bitcoin recently matched its all-time high price of $69,000, only to experience a correction shortly after that. A new ATH marks a significant moment for the crypto market and serves as a critical moment for understanding the driving forces behind crypto rallies.
On-chain data, containing a wealth of information related to all activity settled on the Bitcoin network, plays a crucial role in decoding these forces. It offers an empirical foundation to analyze the actions and sentiments of users and investors, providing insights into the current state and trends of the Bitcoin market.
Bitcoin brief stint at just above $69,000 is a culmination of various factors, including investor optimism, market speculation, macroeconomic factors, and perhaps most importantly, the underlying maturity of the Bitcoin network. Analyzing on-chain data allows us to peel back the layers of surface-level price movements to reveal the operational and behavioral patterns of the market.
On-chain data refers to the publicly available information recorded on the blockchain. This includes metrics such as the number of active addresses, which indicate user engagement and network utilization; transaction volumes, which reflect the liquidity and movement of Bitcoin within the ecosystem; and the balance of Bitcoin on exchanges, providing insights into market sentiment and potential supply pressures.
In this report, CryptoSlate will dive deep into these metrics to better understand the market forces leading up to, during, and after Bitcoin’s journey to the new ATH.
Addresses
Tracking the variations in address metrics, such as the number of active addresses and those with a non-zero balance, offers a direct view of user engagement, investor sentiment, and potential shifts in market trends. These metrics show the network’s health and vitality while providing insights into the broader changes in behavior that drive market movements.
Number of Active Addresses
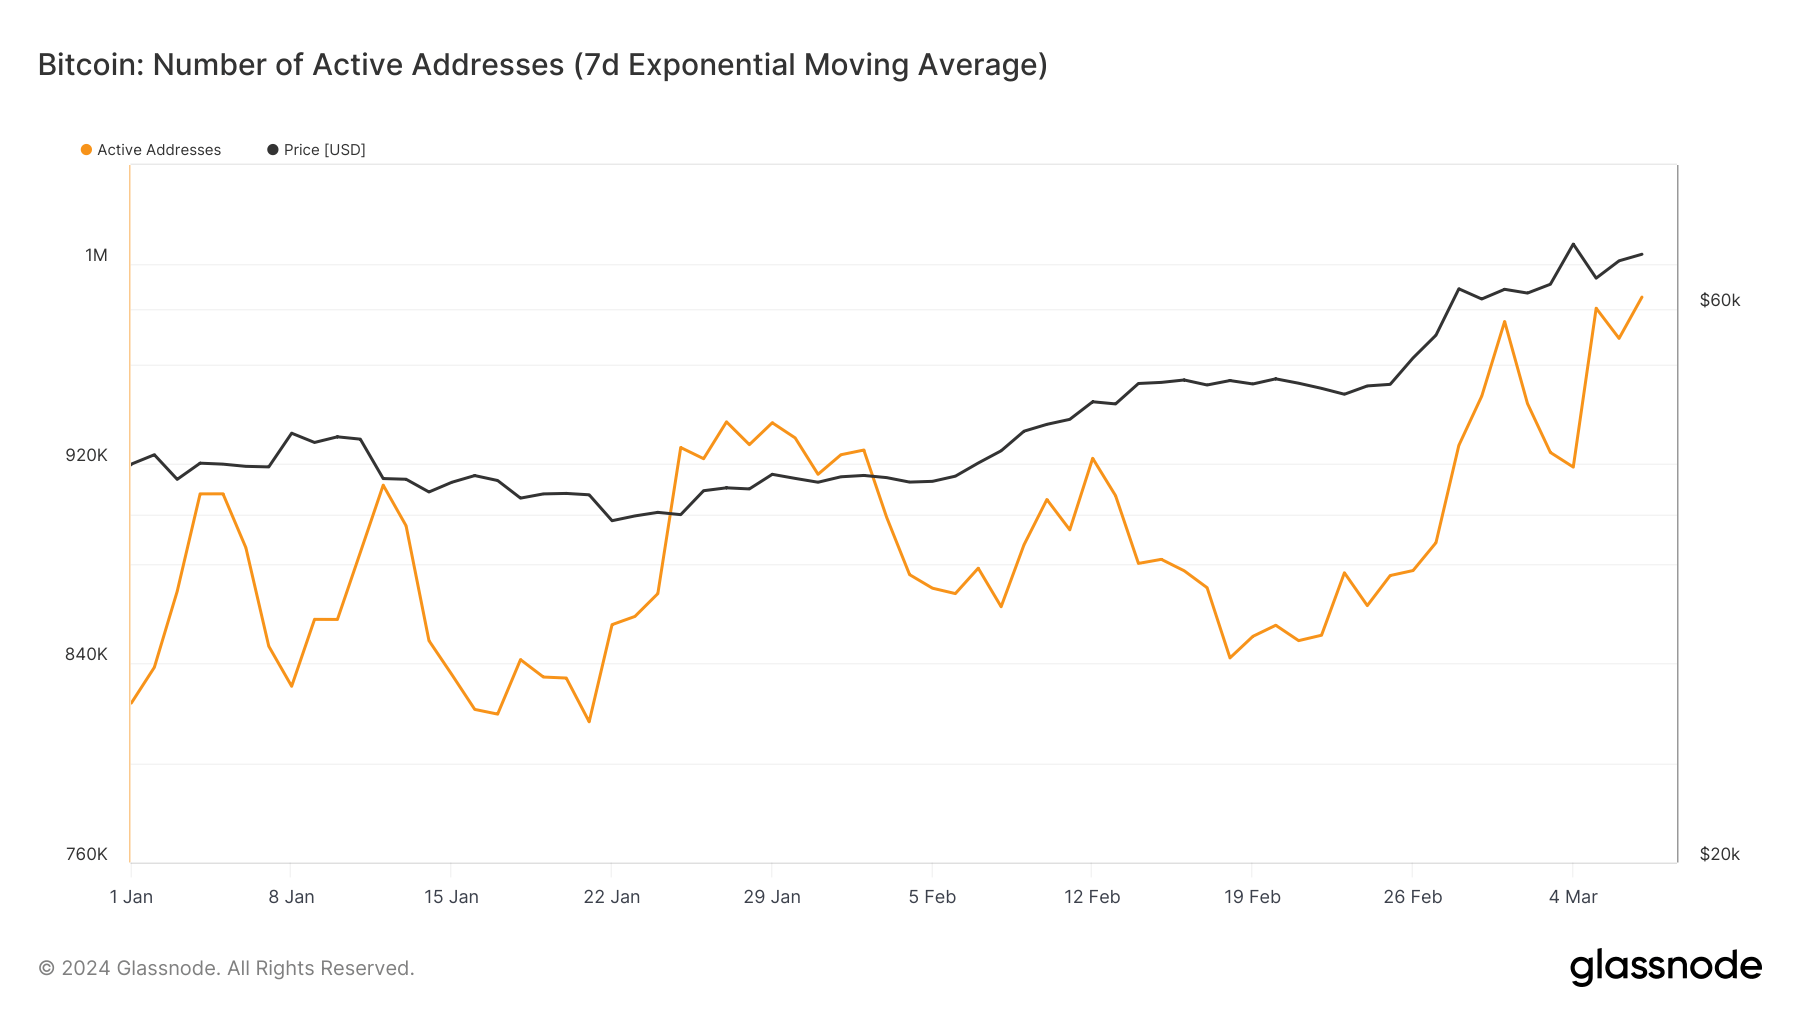
The number of active addresses, observed through the 7-day exponential moving average, provides a granular view of network activity over time. On Mar. 7, active addresses surpassed 986,000, marking a substantial increase from the 824,000 recorded at the beginning of the year. With a significant jump to 918,000 by Mar. 4, this increase mirrors heightened activity in the market during Bitcoin’s rapid movements towards and away from its ATH.
Glassnode’s data showed that 68,000 new addresses were activated within three days, highlighting the dramatic influx of participants engaging with Bitcoin, drawn by the volatility and opportunities it presented. Such spikes in active addresses can indicate increased trading activity, new user adoption, or re-engagement from existing holders, all pivotal factors that can drive or reflect major price movements.
Number of Addresses with a Non-Zero Balance
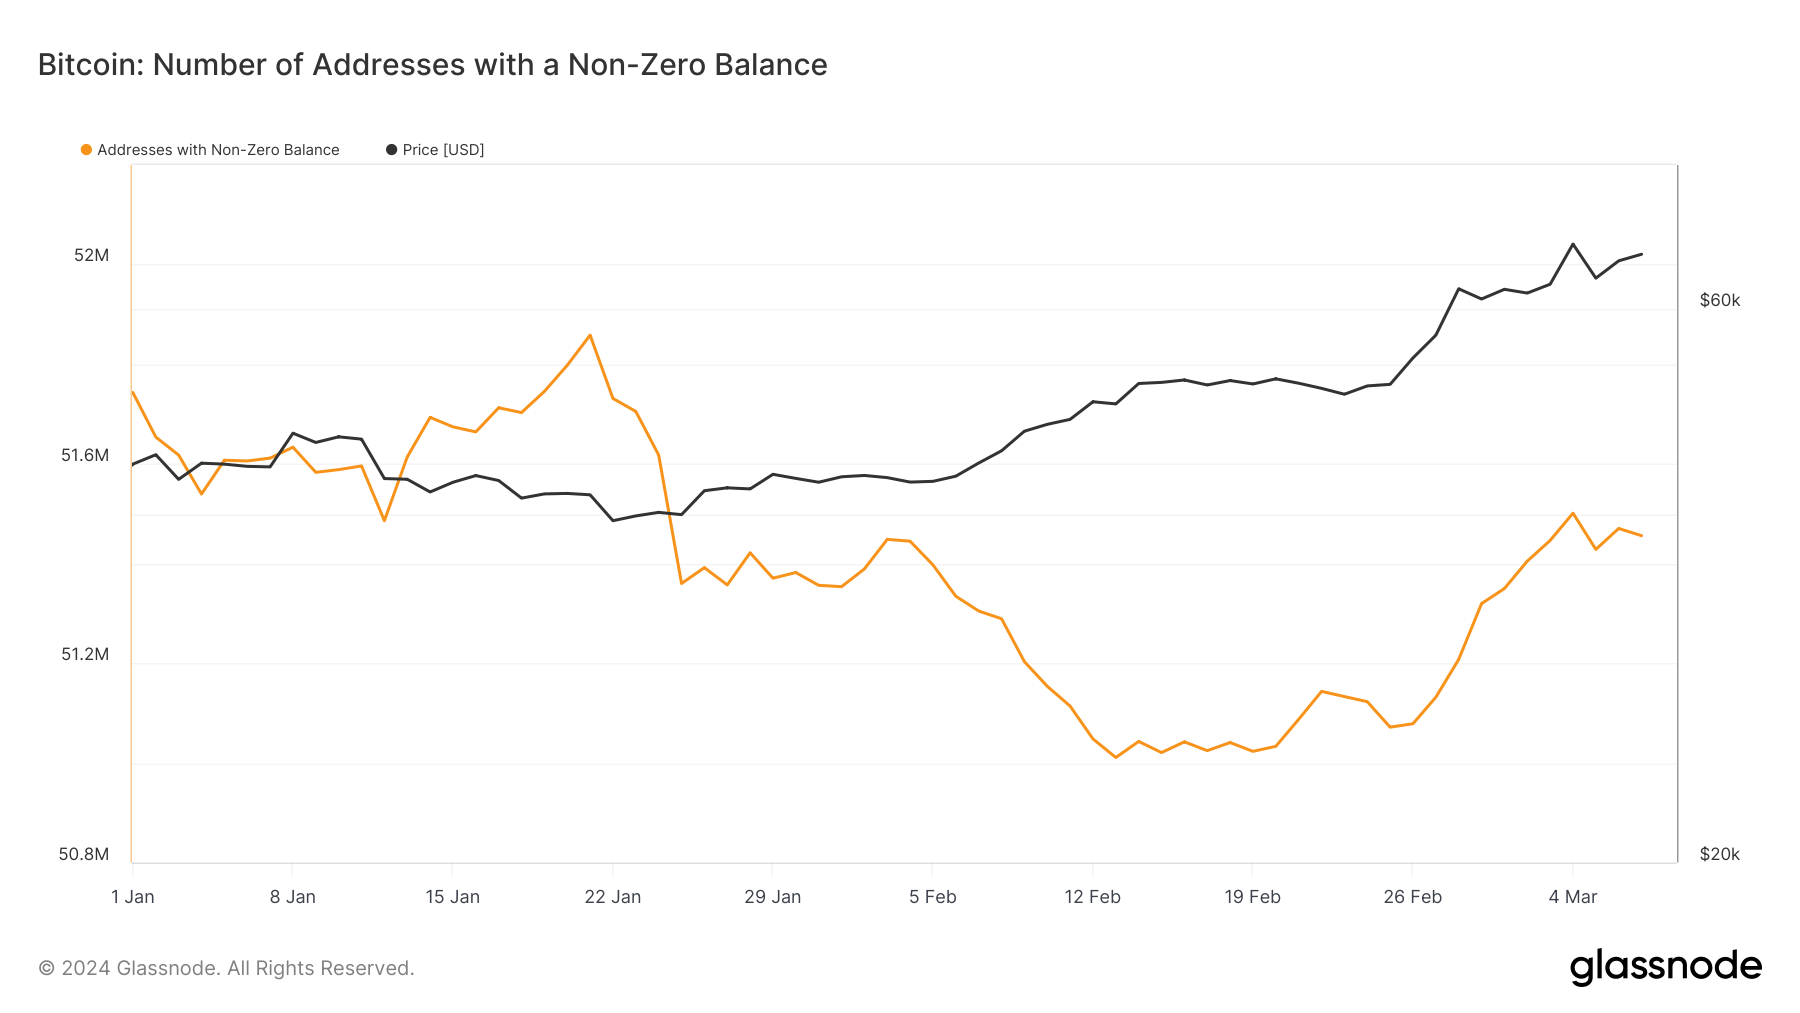
The number of addresses with a non-zero balance is equally telling of the state of the market. These addresses increased from 51 million on Feb. 25 to a peak of 51.5 million by Mar. 4, right as Bitcoin reached its ATH. This shows a correlation between rising prices, the broadening of the participant base, and accumulation behaviors.
The slight reduction to 51.45 million addresses by Mar. 7 could result from various factors, including profit-taking following the peak, a minor consolidation phase among holders, or a temporary shift in strategies in response to the correction. The fluctuation in the number of addresses with a non-zero balance shows the reactive nature of market participants to price swings and highlights the importance of on-chain metrics like these for gauging the market’s response to volatility.
Transactions
Analyzing on-chain transaction data is crucial for understanding the depth and breadth of market activity. Looking at metrics such as the number and volume of transactions alongside the activity of small and large entities provides insights into liquidity, trading behaviors, and market sentiment that influences Bitcoin’s price movements. These metrics show the immediate market response to external stimuli and serve as indicators of broader trends in adoption and investment strategies.
Number of Transactions
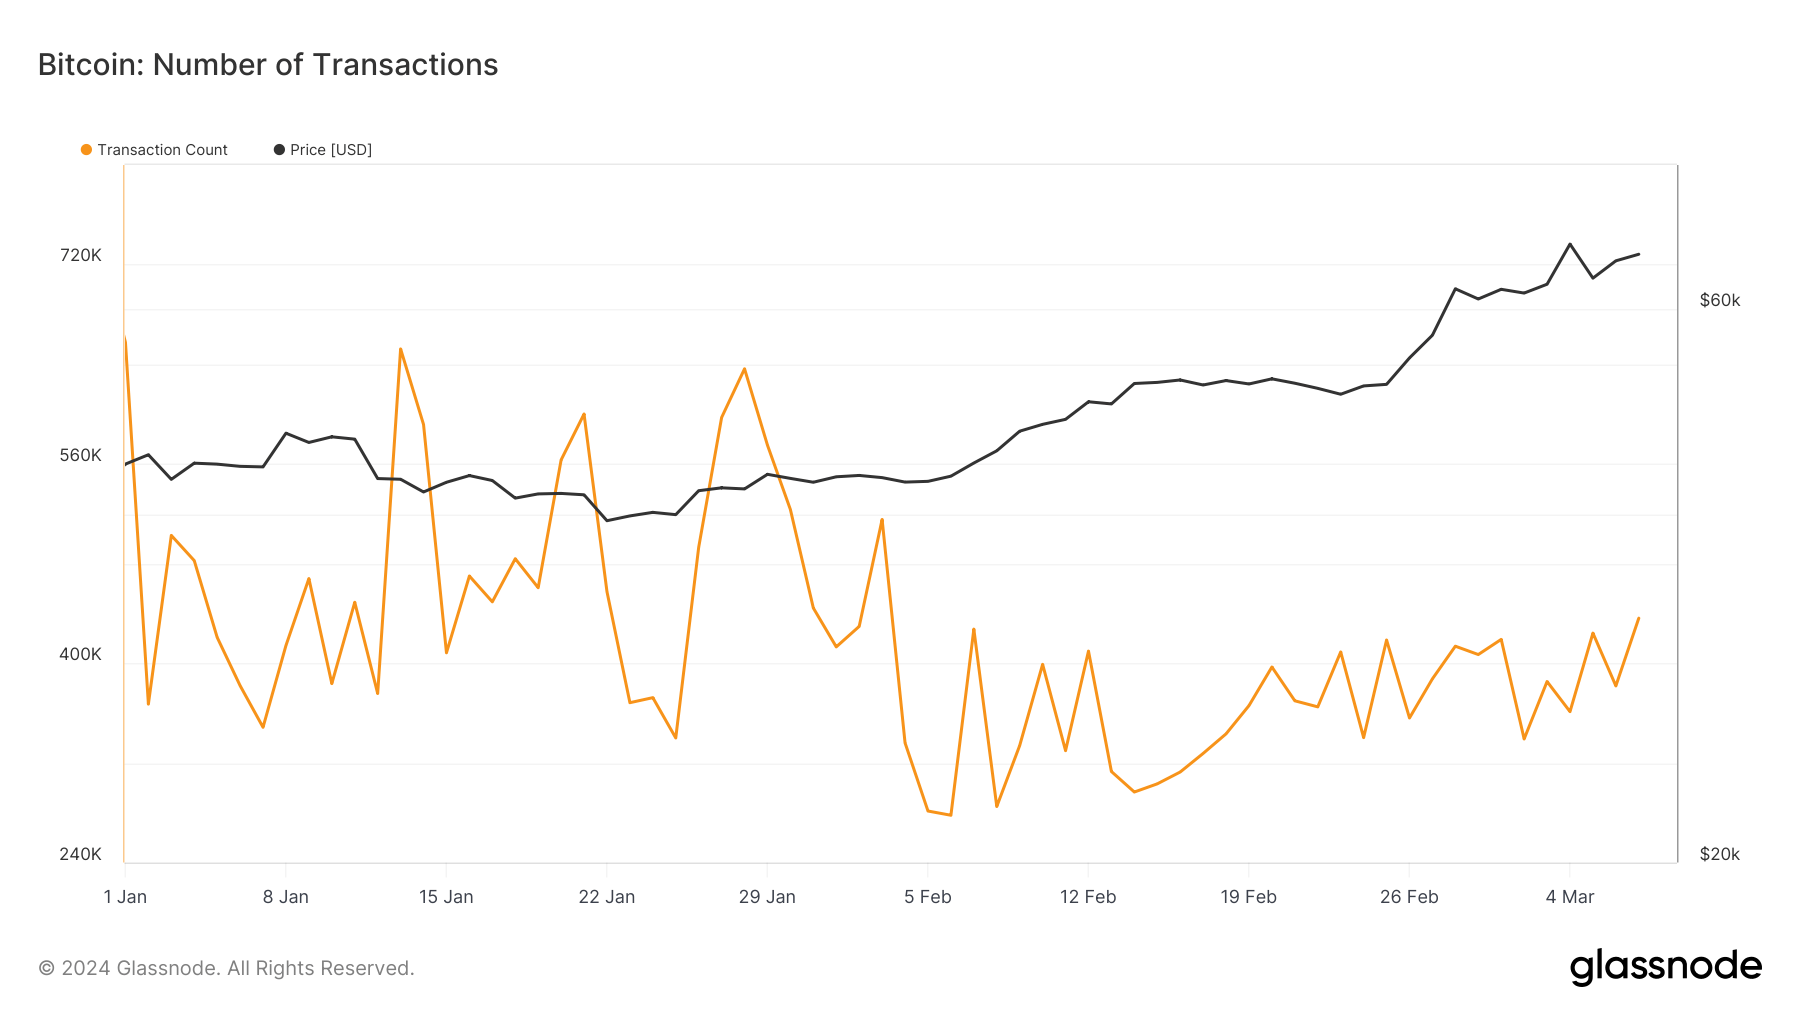
During Bitcoin’s rise to $69,000, the total number of successful transactions on the network showed surprising stability, oscillating between 378,000 and 399,000 during March. This relative flatness in transaction count during a period of significant volatility is relatively unusual.
One plausible explanation lies in the growing prevalence of off-chain trading on centralized exchanges, which doesn’t contribute to on-chain transaction counts. As traders increasingly use these platforms for their liquidity and speed, the on-chain transaction metric fails to fully capture the scope of trading activity parallel to the price rally. This discrepancy shows the need to consider both on-chain and off-chain metrics to gain a complete understanding of Bitcoin trading behavior.
Transfer Volume
Transfer volume, showing the total USD value of Bitcoin moved on-chain, saw a significant increase during Bitcoin’s price rally. Rising from $37.3 billion on Feb. 25 to $67.24 billion on Mar. 1, it peaked on Mar. 4 at $79.64 billion. It is the highest transfer volume the network has seen since September 2022.
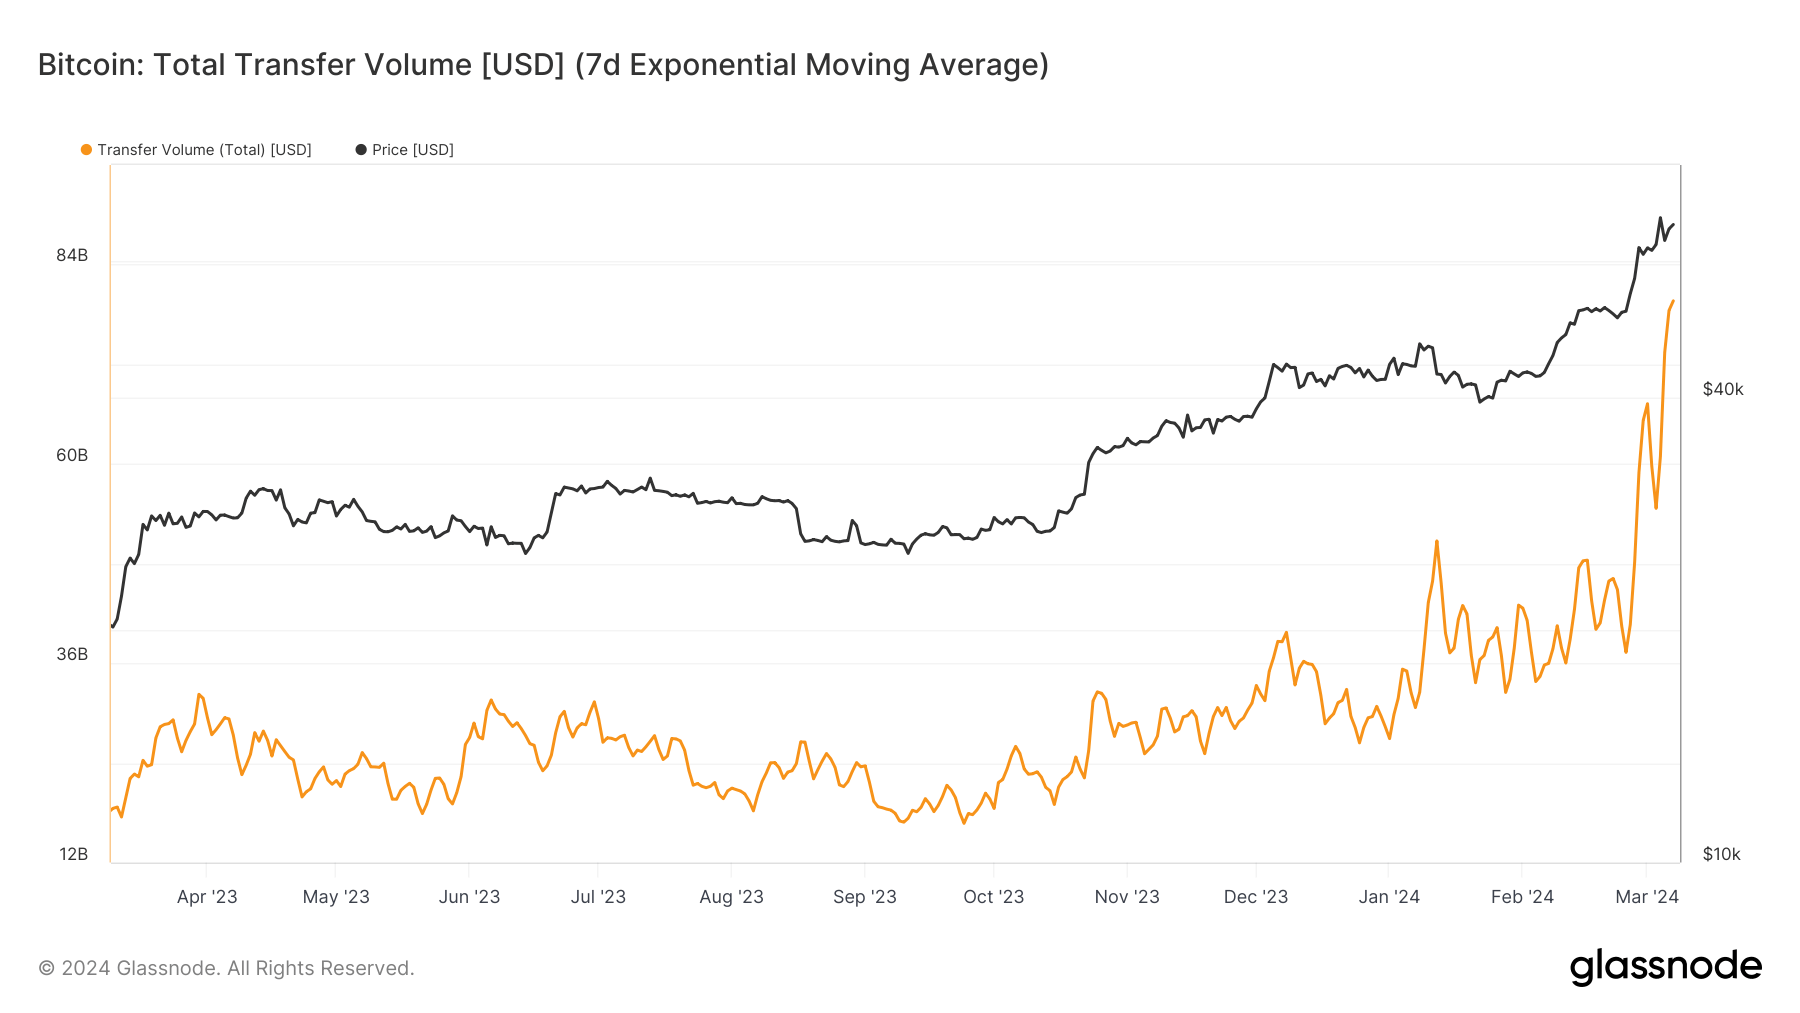
The sharp increase in transfer volume is mainly attributable to the increase in Bitcoin’s price. With Bitcoin’s USD value rising rapidly, even the same number of coins settled over the period would result in a higher dollar value. However, the sustained increase in volume, even as prices corrected to $59,000, shows that a substantial portion of this increase was driven by increased coin movement across the network.
It shows robust engagement from market participants and a movement beyond speculative trading to potentially include strategic accumulation and distribution of BTC holdings.
Relative Activity of Small and Large Entities
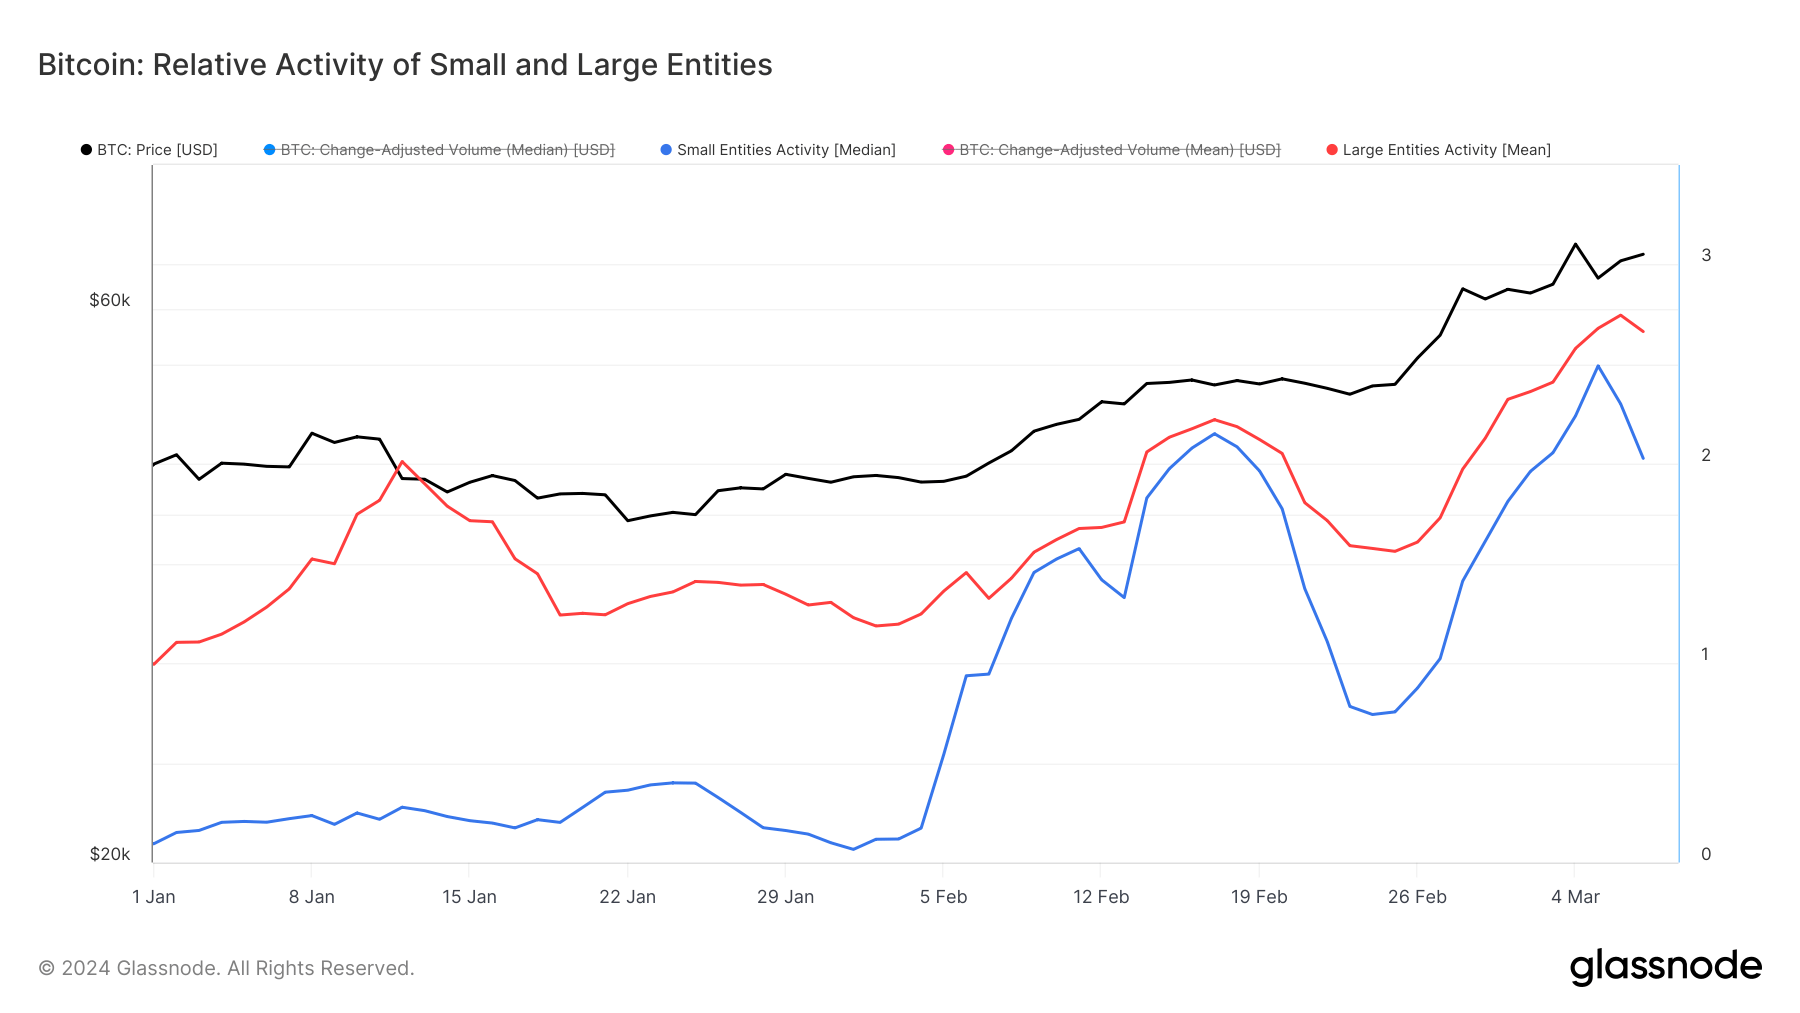
Analyzing the transaction volumes of small and large entities reveals the composition of the market and shows differences in investor behavior. The metric looks at the difference in USD-denominated Bitcoin transaction volumes and assumes smaller entities typically contribute to a greater frequency of transactions than their larger counterparts. A simultaneous uptick in activity from small and large entities indicates a market-wide interest in Bitcoin.
Data from Glassnode shows that a sharp spike in the relative activity from both entities started in late February. This is a continuation of the trend that began earlier this year, where an uptick in activity from large entities followed the launch of spot Bitcoin ETFs in the US.
The gap between the two groups has been getting smaller as their relative activities increased, showing a mixed market driven both by retail and institutions.
Exchanges
On-chain metrics, including the total Bitcoin balance on exchanges and the exchange net position change, are pivotal for understanding the flow of Bitcoin and potential shifts in supply and demand.
However, it’s important to acknowledge the limitations of these metrics, primarily due to the significant volume of transactions and trading activities occurring off-chain within exchange platforms. This off-chain activity can somewhat mask the true market liquidity and investor sentiment, as these transactions do not directly impact the blockchain.
Bitcoin Balance on Exchanges
Bitcoin balances held in exchange wallets are a telling indicator of the market’s stance toward holding versus trading. Since March 2020, there has been a consistent decline in the amount of Bitcoin stored on exchanges, a trend that not only persisted into 2024 but appeared to accelerate as Bitcoin approached and surpassed its ATH.
Specifically, exchange balances dwindled from approximately 2.364 million BTC in the last week of February to 2.287 million BTC by Mar. 1. A temporary uptick to 2.309 million BTC was observed on Mar.5, attributed to short-term trading volatility around the ATH before settling back to 2.293 million BTC by Mar. 8.
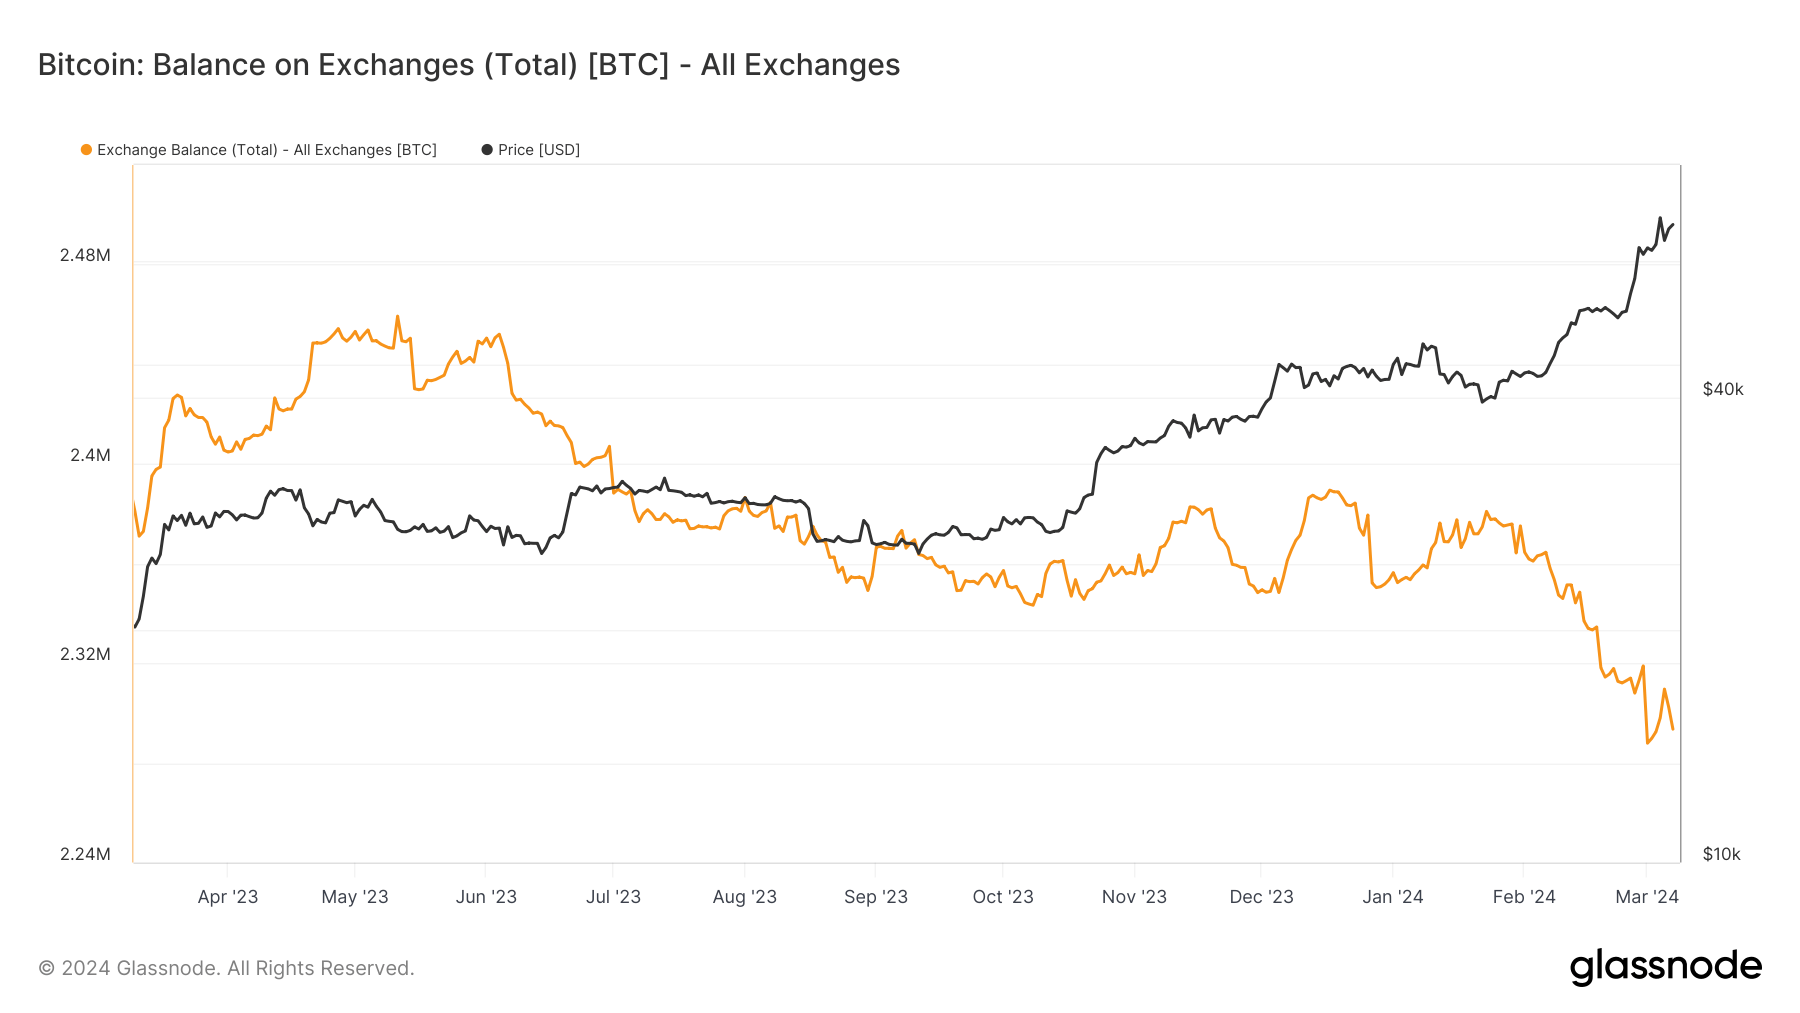
This consistent decline in exchange-held Bitcoin shows that the market is maturing. Investors choose to move their assets off exchanges, either in private wallets or cold storage, suggesting a market-wide preference for long-term holding.
The implication is clear: as more BTC is moved off exchanges, the reduced supply against a backdrop of increasing demand could catalyze future price rallies.
Exchange Net Position Change
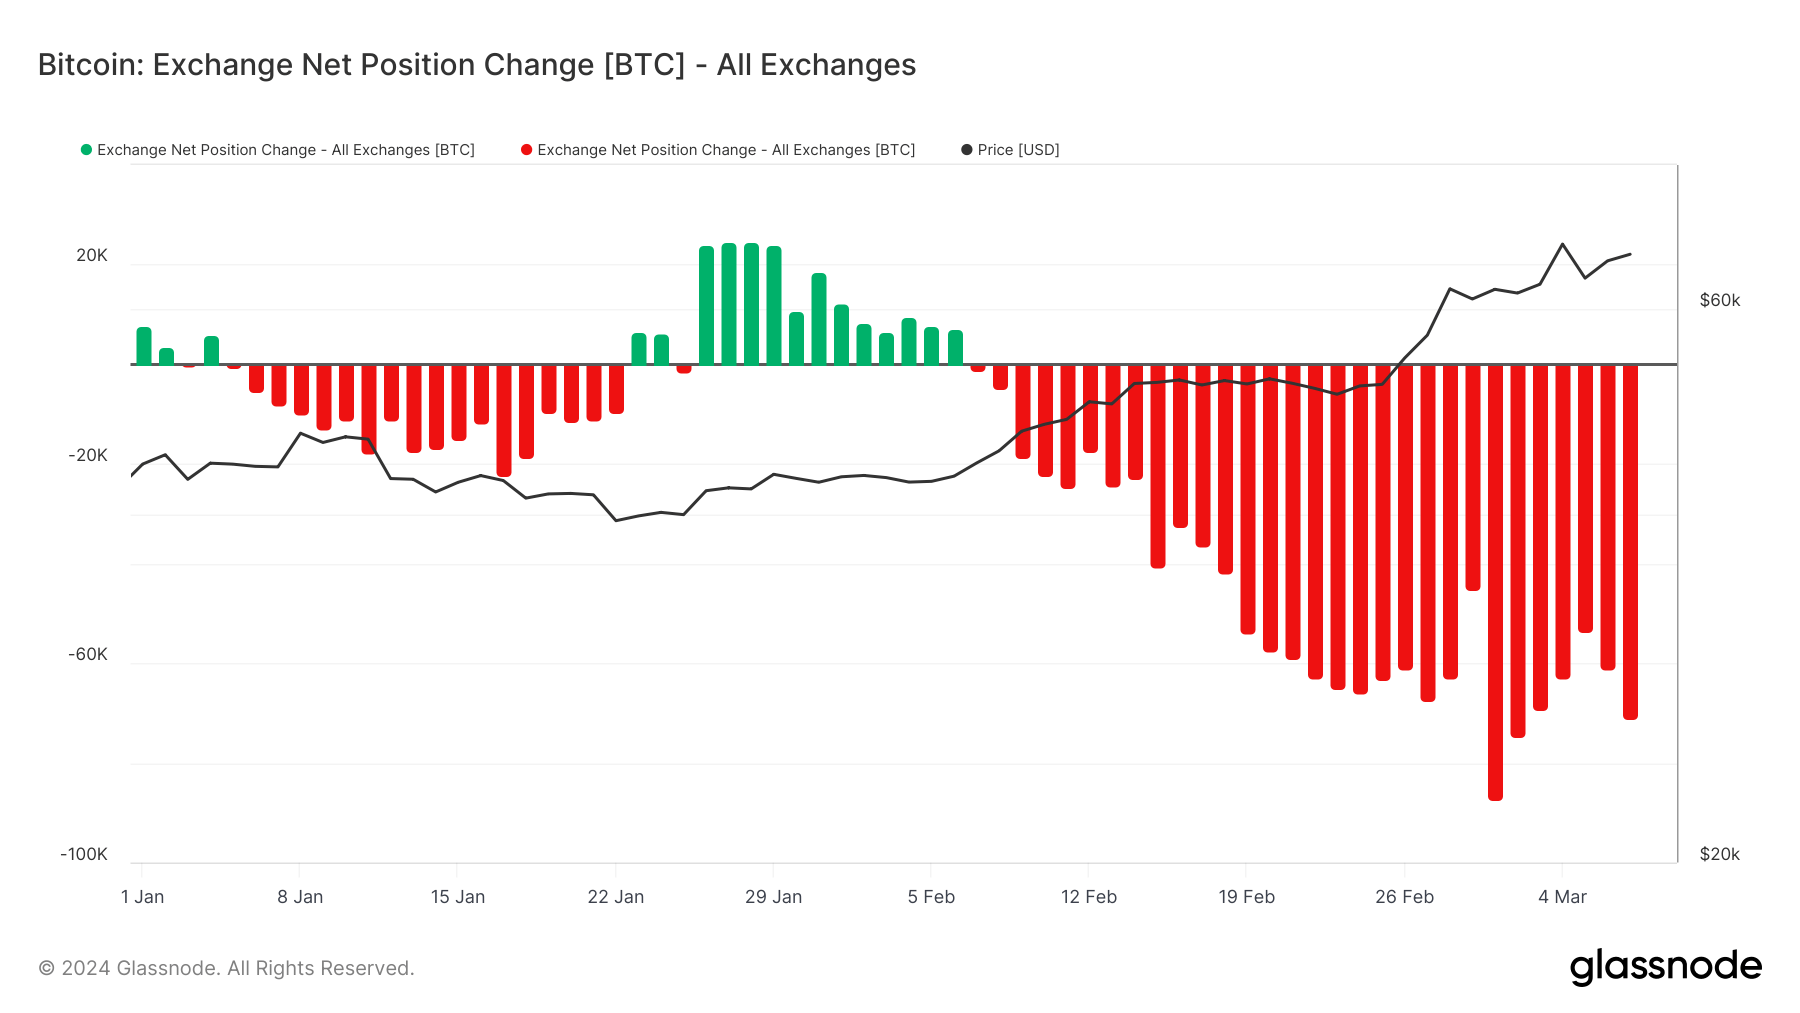
The exchange net position change metric, representing the 30-day change in Bitcoin supply on exchanges, offers further insights into the flow of Bitcoin across the market. Consistently negative since the first week of February, this metric reached its most significant point of the year on Mar. 1, with 87,214 BTC withdrawn from exchanges. This aligns with the observed decline in exchange balances, confirming more Bitcoin is being moved into more secure storage solutions by traders, particularly following profit-taking or strategic acquisitions of BTC.
The surge in outflows between Mar. 5 and Mar. 7 following the ATH aftermath suggested that many took advantage of the price peak to secure profits or reallocate their investments.
Conclusion
Given these insights, the current state of the Bitcoin market is one of vibrant activity and strategic positioning by its participants. The reduced Bitcoin supply on exchanges and increasing network engagement suggest a bullish sentiment in the medium to long term. However, potential bearish scenarios could emerge from macroeconomic factors or regulatory changes that might impact investor sentiment and market trends.
Predicting Bitcoin’s future price trajectory involves weighing these complex and sometimes contradictory signals. Should the trend of declining exchange balances and robust network activity continue, it could lead to a supply squeeze, potentially driving prices upward. Conversely, external shocks or negative market sentiment could temper these bullish prospects.
More Market Reports


