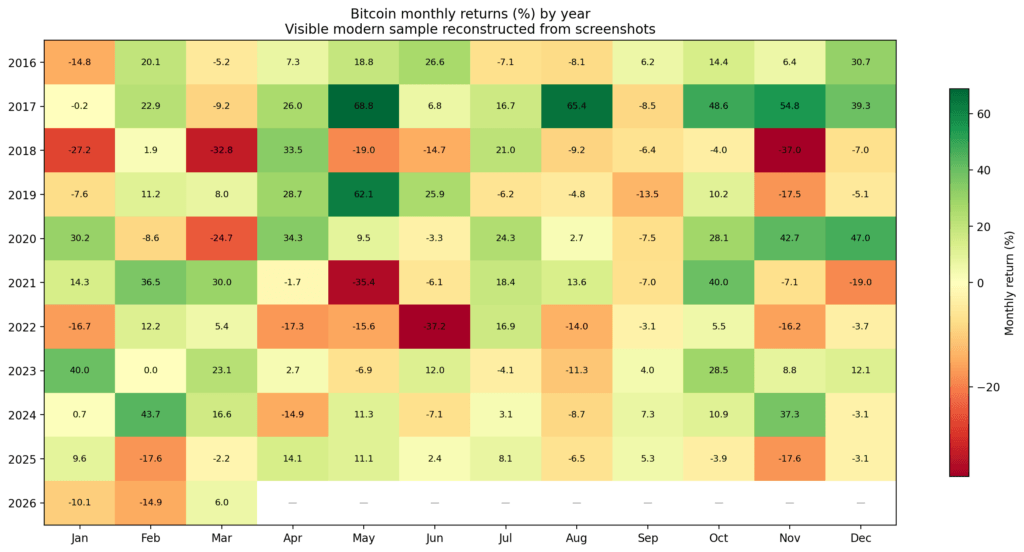
Bitcoin has never finished a year positive after a start this bad
Bitcoin seasonality is one of those market narratives that stays alive because the average is easy to screenshot. The problem is that the average often hides the only thing that matters: the state.
A strong “Uptober” inside a healthy bull trend is not the same trade as a strong October after a year that spent the first quarter underwater. A positive December mean is not an edge if the median month is still negative. And a hot Q1 is not automatically a continuation signal if the market has already pulled forward most of its upside.
That is the core result here. The useful part of Bitcoin price seasonality is not the calendar alone. The interaction between month, regime, and path is far more important.
Heatmap of Bitcoin monthly returns by year from 2016 to 2026, with green gains and red losses.
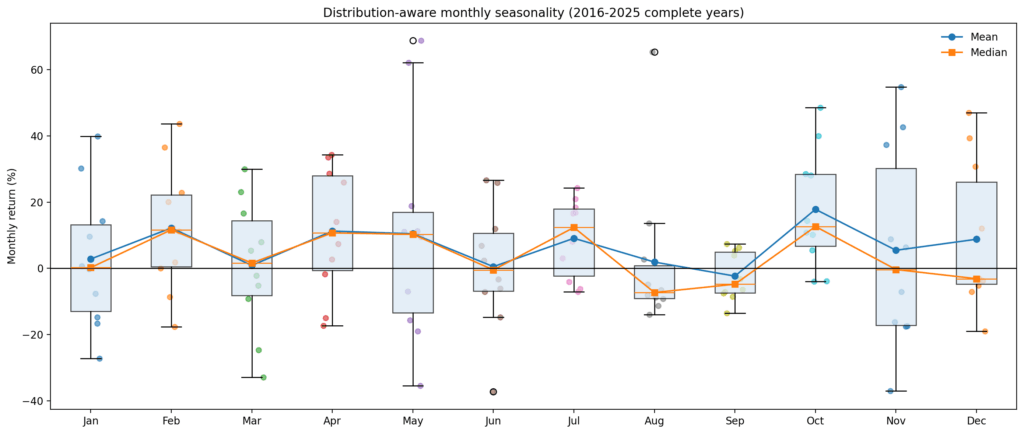
The first problem with the seasonality story is that averages flatter the distribution
If you only look at mean monthly returns, Bitcoin appears to offer a menu of recurring bullish windows. In the modern sample, October stands out with a mean return of 17.8%, a median of 12.7%, and an 80% win rate. July also holds up well, with a 9.1% mean return, a 12.4% median, and a 70% win rate. February and April look reasonably constructive, too.
But once you move beyond averages, the picture changes fast.
August is the cleanest example. The mean return is slightly positive at 1.9%, which sounds benign until you look underneath it: the median is -7.3%, the win rate is just 30%, and the distribution is positively skewed.
In plain English, August has not been a dependable “up month.” It has been a low-hit-rate month, occasionally rescued by a few large upside outliers.
December has the same problem in a softer form. The mean is positive, but the median is negative and the win rate is only 40%. November is similar: a headline-positive average, but a distribution with enough variance and downside tail to make the average far more flattering than the lived experience of holding risk through it.
May is another trap. The average return looks healthy, but dispersion dominates the month. The upside tail is large, the downside tail is large, and the standard deviation is high enough that “May is positive on average” tells you very little about what kind of risk you are actually taking.
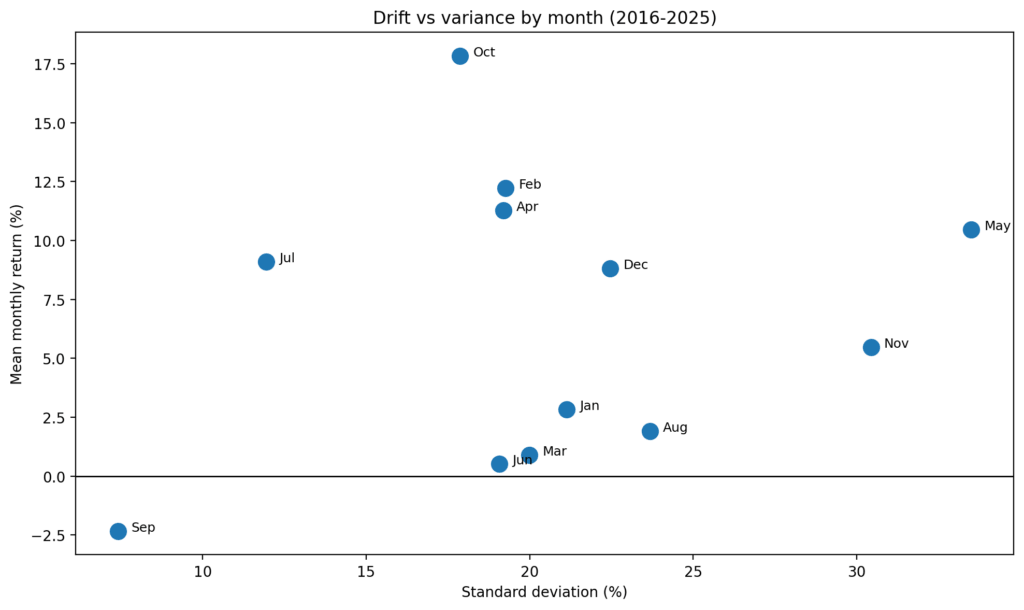
Box-and-whisker chart of Bitcoin monthly returns from 2016 to 2025, showing the distribution for each month with mean and median lines.Scatter plot titled showing each month’s mean Bitcoin return versus standard deviation; October has the highest average return, while September is the only month with a negative average return.
Some months are drift-dominant, where the mean, median, and win rate broadly line up. Others are variance-dominant, where the average is doing more storytelling than forecasting.
The months that look most usable are not the ones most people talk about
The cleanest month is October. Not because it always works (it does not), but because its average, median, and win rate all point in the same direction.
July is the next-best example. Those are the closest things in the data to stable seasonal windows.
By contrast, some of the more familiar seasonal talking points look fragile.
August’s positive mean is mostly an artifact of skew. November and December can work, but they are not clean trend months in the statistical sense. They are conditional months that need confirmation from regime and path.
That is the first big line between edge and illusion. A month with a positive average is not necessarily a month with a repeatable edge.
If the median is negative and the win rate is weak, what you have is not seasonality. What you have is optionality disguised as consistency.
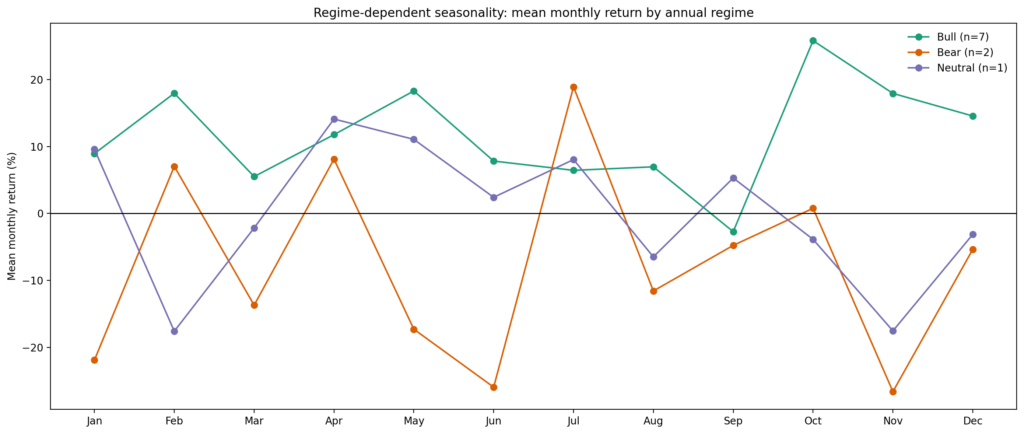
The next step was to split years into objective regimes: bull years with annual returns above 50%, bear years below -20%, and neutral years in between.
Once you do that, unconditional seasonality starts to look less like structure and more like a blended average of opposite states.
Several months flip sign depending on regime, including January, March, May, June, August, November, and December.
In other words, the same month that looks constructive in the full sample can turn negative once you isolate a weaker macro backdrop.
That is exactly what you would expect if seasonality is downstream of market state rather than independent of it.
Line chart comparing Bitcoin’s average monthly returns across bull, bear, and neutral yearly regimes, showing stronger gains in September to December during bull years and weaker late-year performance in bear years.
There are only a few months that look relatively resilient across regimes. July is the strongest candidate. April is somewhat constructive as well, though less cleanly. September, meanwhile, stays weak enough across major regimes that it deserves respect as a recurring soft patch rather than a one-off anomaly.
The caveat is obvious: the bear sample is small. But that is also the point. If a seasonal claim falls apart the moment you ask whether it survives different states of the world, it was probably never a robust claim to begin with.
The real edge is path dependency, not calendar mythology
The strongest signals are not monthly averages at all. They are state variables tied to the year’s path.
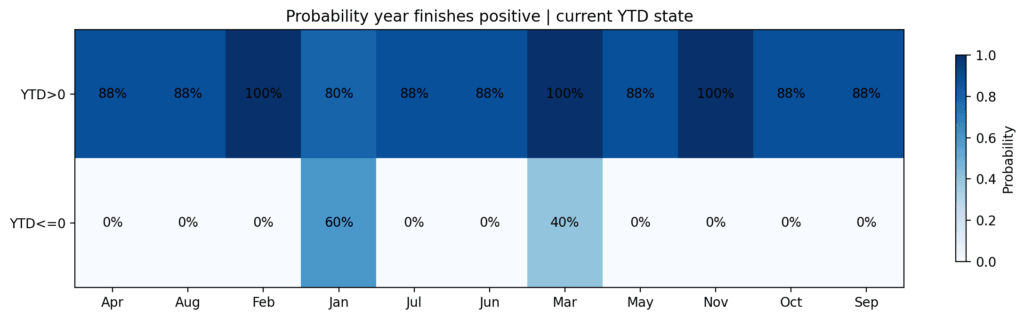
Heatmap showing probability of a positive year-end return for Bitcoin by month and whether the year is currently up or down YTD, with higher probabilities concentrated when BTC is already positive YTD.
In the 2016–2025 sample, if Bitcoin was positive year-to-date after February, it finished the year positive seven out of seven times.
If it was negative year-to-date after February, it finished positive zero out of three times.
After March, the split was still material: positive YTD years finished positive five out of five times, while negative YTD years only finished positive two out of five times.
That is not a trivial distinction. It suggests that by late Q1, Bitcoin’s seasonal profile is already being filtered by whether the year is in a healthy trend or in repair mode.
The market is not simply entering “good” or “bad” months. It enters them from a specific state, which changes the forward distribution.
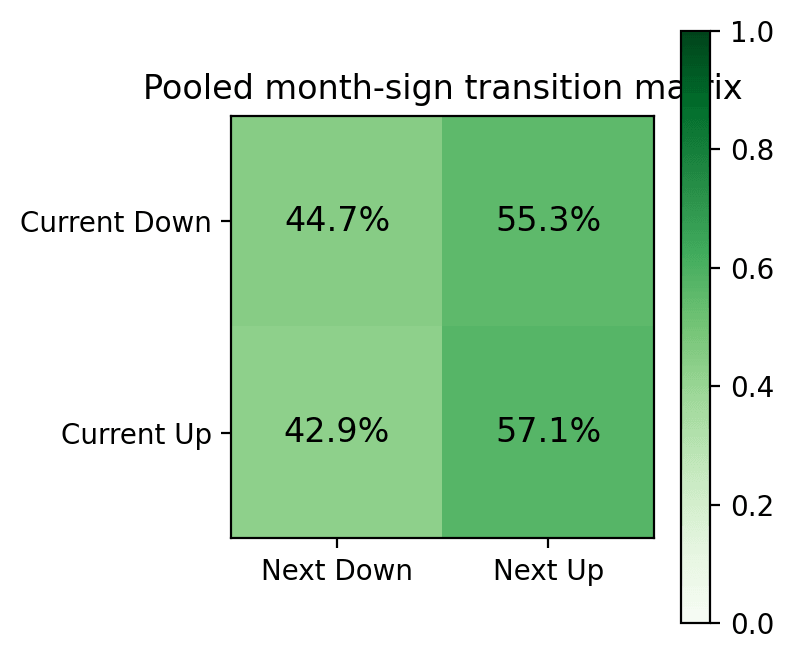
Heatmap showing Bitcoin month-to-month sign transitions, with the next month more likely up than down after both up and down months.
Just as important, simple month-to-month sign momentum does not hold up. After an up month, the next month was positive 57.1% of the time. After a down month, the next month was positive 55.3% of the time. That is not a serious edge.
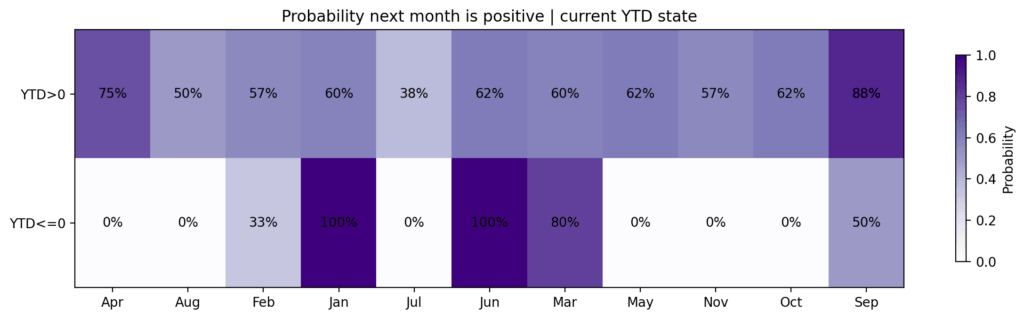
Heatmap showing Bitcoin’s probability of a positive next month by month and whether year-to-date performance is positive or negative
The useful signal only emerges once you condition on the broader path, the YTD trajectory, the Q1 outcome, and whether the year is repairing or breaking.
A strong Q1 helps the year, but often hurts the next quarter
One of the more interesting findings is that strong early-year performance is not a clean continuation signal.
Years with Q1 returns above 20% did go on to finish positive every time. But Q2 in those years was weak on average, with a mean decline of 15.1%.
That's important because it separates direction from timing.
A hot Q1 improved the odds of a positive full-year outcome, but it also tended to pull forward returns and raise the probability of spring digestion.
In other words, the market could remain structurally constructive while still becoming tactically harder to own into Q2.
The data here does not support the leap that a positive year-level tendency is a positive entry signal for the next month or quarter.
June looks like the real decision node
If there is a practical seasonal checkpoint in the data, it is not a single month but the year’s condition by midyear. Years with first-half returns at or below zero never finished positive. Years with positive first-half returns finished positive seven times out of eight, with 2025 as the notable exception.
The same logic shows up in negative-Q1 years. If a weak first quarter was followed by a Q2 rebound greater than 20%, the full-year outcome improved materially.
CryptoSlate Daily Brief
Daily signals, zero noise.
Market-moving headlines and context delivered every morning in one tight read.
5-minute digest 100k+ readers
Free. No spam. Unsubscribe any time.
Whoops, looks like there was a problem. Please try again.
You’re subscribed. Welcome aboard.
If the rebound failed to clear that threshold, the year did not finish positive. That does not make Q2 destiny, but it does make it the most useful repair window in the annual path.
The implication is straightforward. Once a year opens damaged, the burden of proof shifts to Q2.
If the market cannot meaningfully repair by June, the case for leaning on second-half seasonal optimism becomes much weaker.
Why 2026 matters now
That framework is especially relevant for 2026 because the year has already broken one of the cleaner modern path templates.
Every year, a negative January has been followed by a positive February — until now.
2026 opened with a 10% decline in January, fell another 14.8% in February, and then rebounded 6% by mid-March, leaving Q1 down around 19%.
That negative-negative-positive sequence is unusual in the modern sample, and it places 2026 in what is best described as a repair-or-failure state.
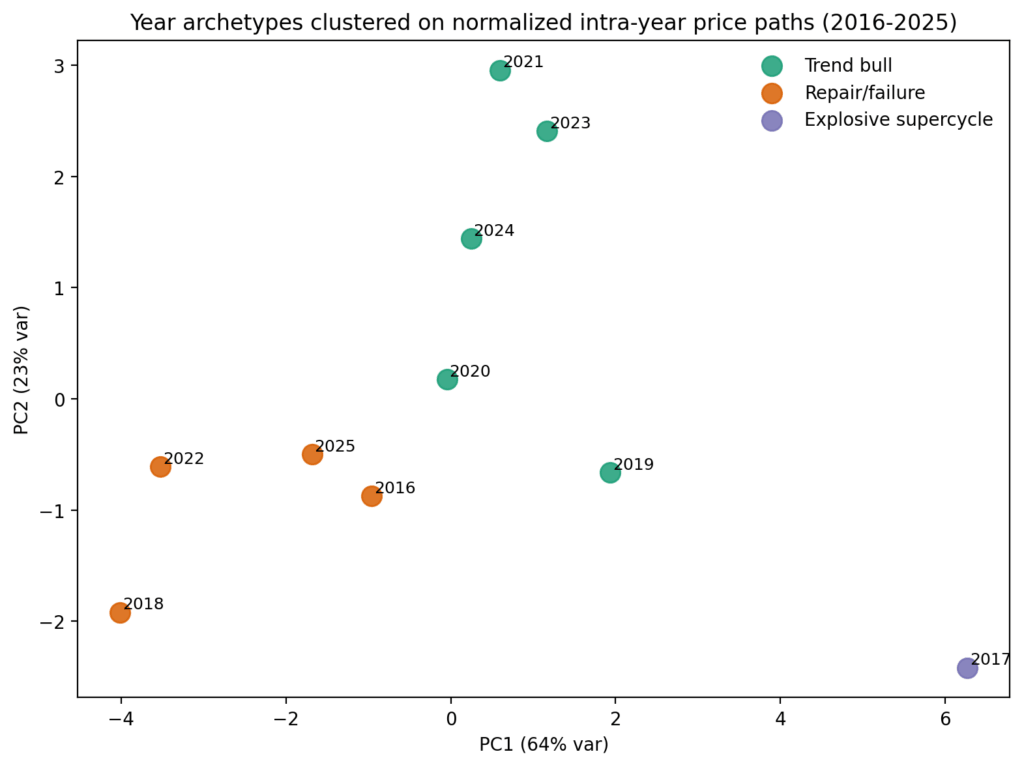
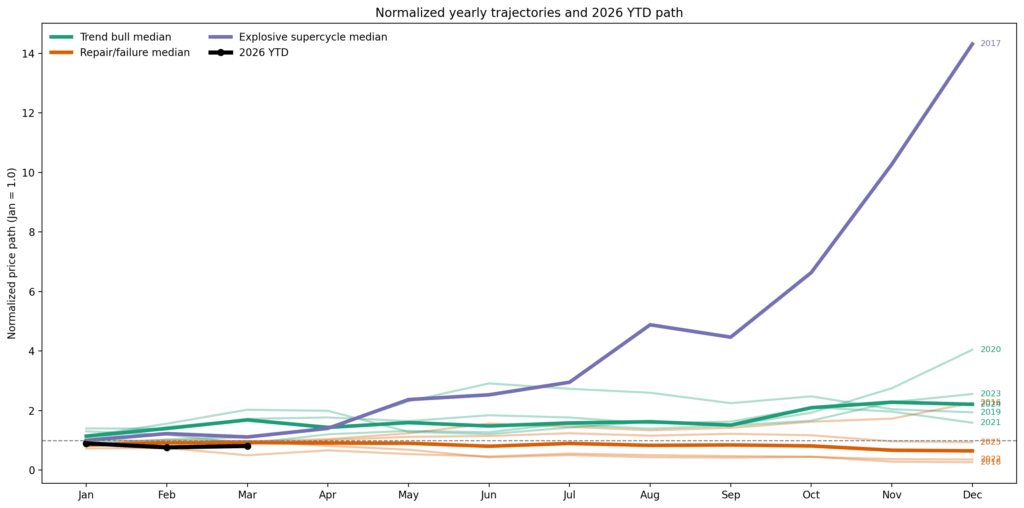
Cluster analysis maps the current year closest to a group that includes 2016, 2018, 2022, and 2025.
Scatter plot clustering Bitcoin year archetypes from 2016 to 2025 by normalized intra-year price paths, with 2021, 2023, and 2024 in the trend-bull cluster, 2016, 2018, 2022, and 2025 in repair-failure, and 2017 in an explosive supercycle outlier.Line chart comparing normalized yearly Bitcoin price trajectories with a projected 2026 path, showing 2026 sharply accelerating into year-end far above prior years and historical median trends.
The correct frame for 2026 is one successful repair year, two failure years, and one rebound-without-trend year. Not “Bitcoin is usually good in Q4,” and not “the worst is over because March bounced,” but rather: can Q2 do enough work to move the year out of a damaged state?
The 2026 scenario tree is a repair test, not a seasonal layup
The most bullish likely direction from here is a genuine repair regime. That would look like a forceful Q2 recovery, some summer digestion, and then renewed upside into the back half of the year.
Historically, the closest analog is 2016, with 2020 as a more explosive upside outlier.
To even get the first half of 2026 back above flat from current levels, Bitcoin would need to compound by over 20% in Q2. To make the year look like a strong repair rather than a partial bounce, it would need substantially more.
The bearish path is a continuation failure, with 2018 and 2022 as the obvious reference points. In that path, spring strength proves tactical rather than structural, the market reopens downside later in Q2 or Q3, and the usual “good months” fail to do the heavy lifting investors expect of them.
2026 is not in a state where unconditional seasonality should be trusted. The year needs to earn a better seasonal profile through repair.
Today's sell-off is not helping the case for a bullish rebound, suggesting the potential ceiling for Bitcoin in 2026 is around $88,000.
So where is the edge?
Bitcoin seasonality provides the most value in a narrow set of situations. It is useful when a month already has a strong historical distribution and the year enters that month from a healthy state. October and July are the best examples in the modern sample. They look more like genuine drift windows than variance accidents.
Seasonality is also useful as a filter on damaged years. If Bitcoin is still negative year-to-date into spring, the calendar by itself is not enough. What matters is whether Q2 can repair the year’s path. If it can, the second half becomes materially more credible. If it cannot, the market’s more optimistic seasonal narratives start to look like wishful extrapolation.
Where seasonality becomes illusion is in regime-blind averages and outlier-driven means. A positive average month with a negative median and weak win rate is not a clean edge.
A favorable calendar month inside a damaged annual path is not a setup on its own. And a strong Q1 is not a license to assume uninterrupted continuation through Q2.
The bottom line
The market moves through January, July, and October, not in a vacuum, but in different regimes, with different YTD trajectories, after different types of first-quarter behavior.
Once you account for that, most of the broad seasonal story gets weaker, but the parts that survive become more actionable.
Bitcoin seasonality is not dead. It is just mostly conditional. The real edge is not in memorizing the “best months.” Recognizing when the market has earned the right for those months to matter is the real skill.
For 2026, that means one thing above all else: Q2 is the test.
If Bitcoin can repair enough damage by June, the second half deserves the benefit of the doubt. If not, then whatever the calendar says, the path is telling you something else.