Cover art/illustration via CryptoSlate. Image includes combined content which may include AI-generated content.
Through analysis of Bitcoin futures leverage, spot market order books, and psychological trading levels, I created a set of channels that have proved surprisingly resilient over the past six months.
I've not day traded crypto since 2021, focusing instead on dollar cost averaging into Bitcoin daily. The removal of the emotional aspect of trading allowed me to focus on the data without projecting my personal feelings into trades and analysis.
Looking solely at the 30-minute price chart for Bitcoin, I drew horizontal lines according to repeating close prices to identify where traders may be looking to place stop-losses. I then compared these levels to Coinglass's liquidation levels to see which aligned with high leverage. Finally, I reviewed the Binance spot market order book to analyze where large buy and sell orders were placed outside the current mid-price.
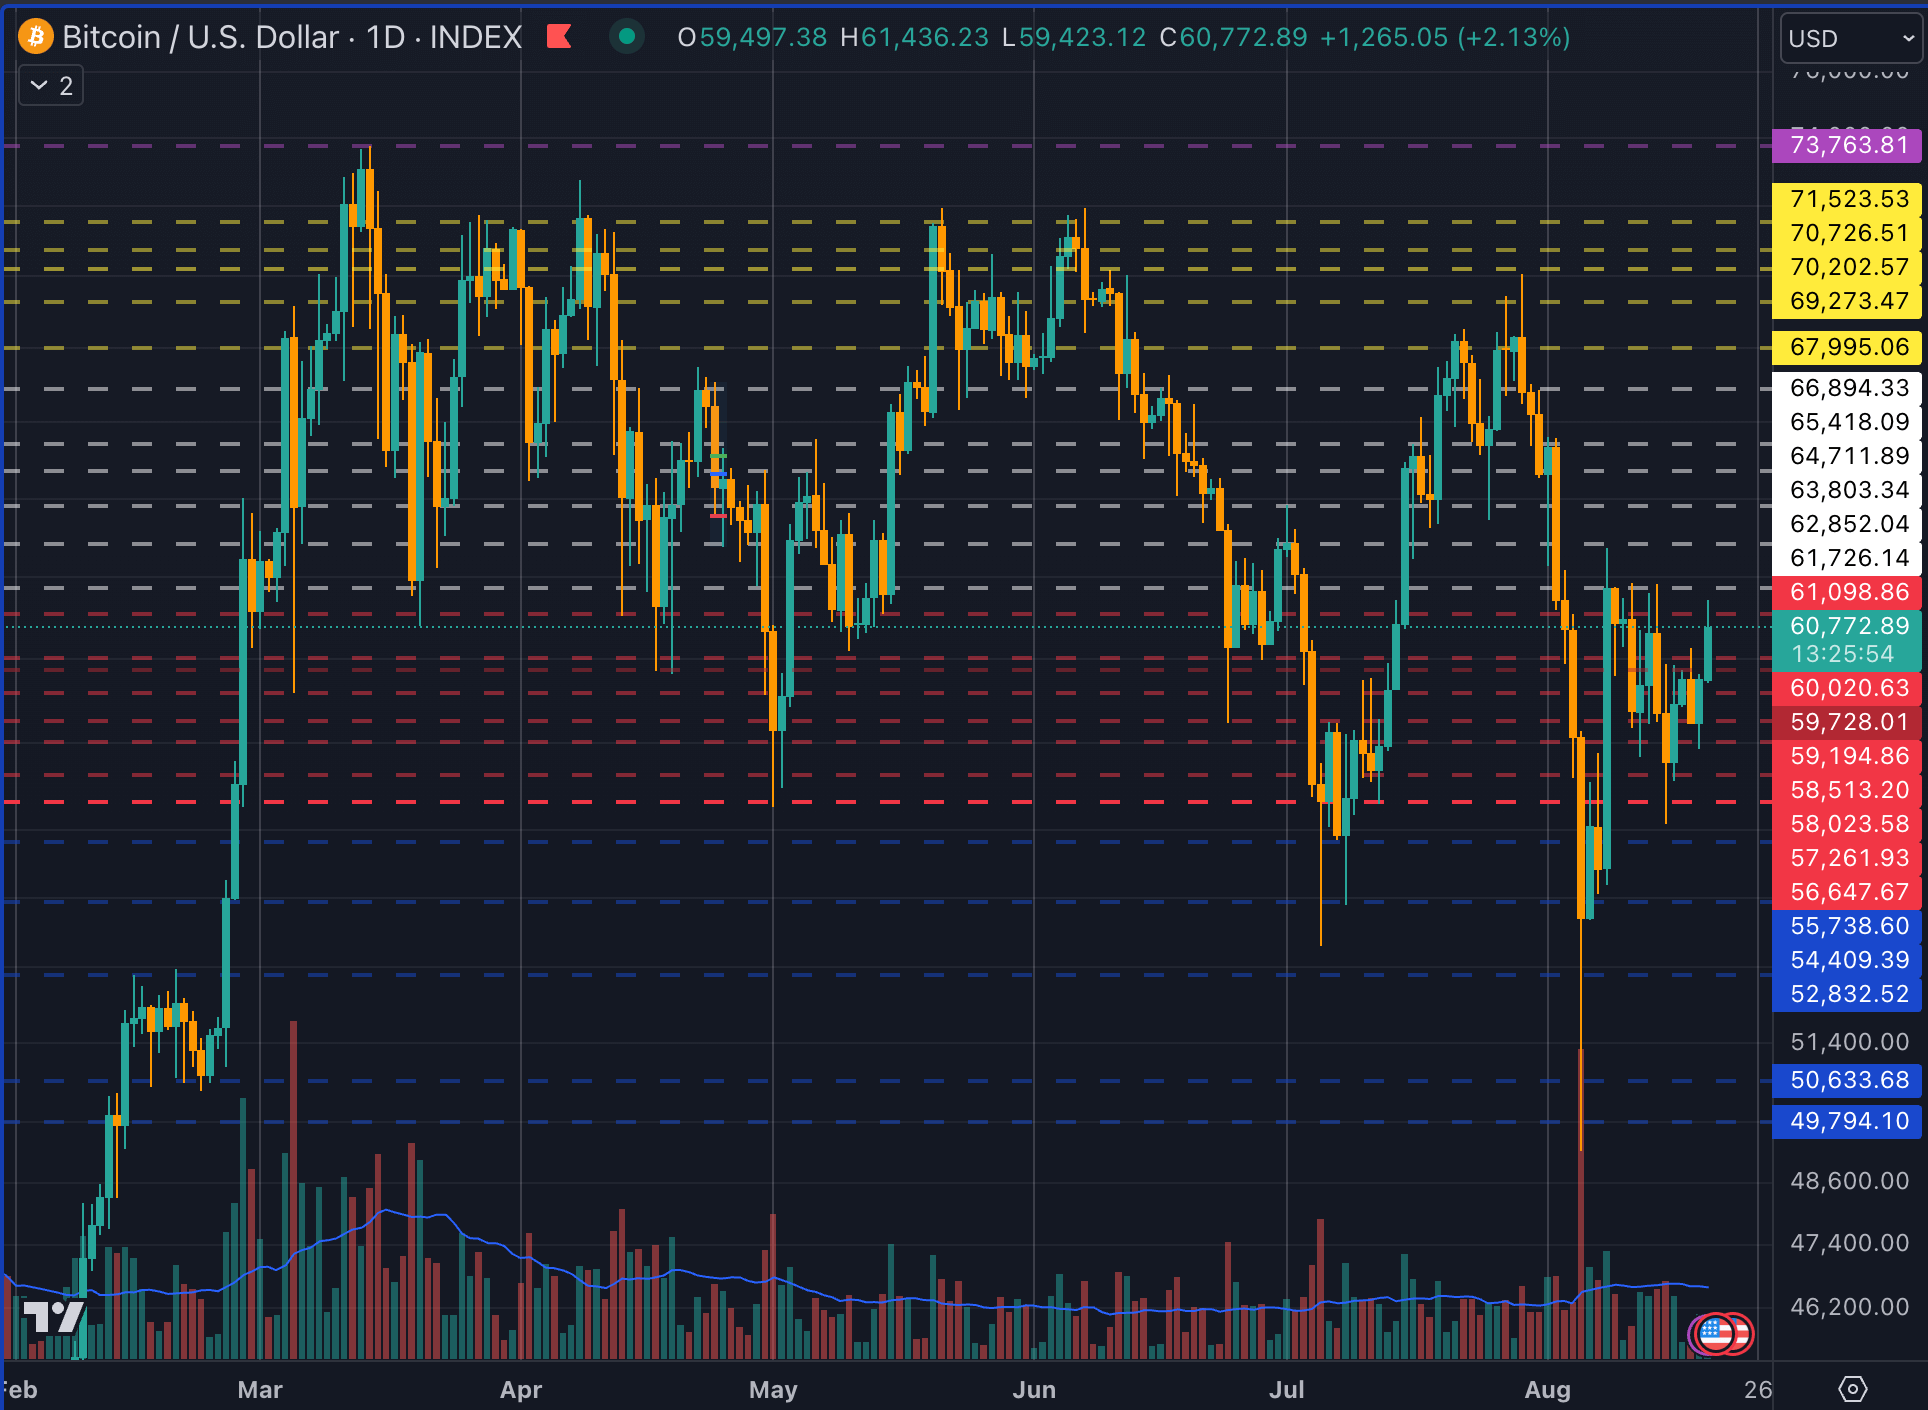
Based on this seemingly simple analysis, I created four channels throughout February and March to not predict the market but to identify where we could expect support and resistance. Over the past six months, these channels have matched local bottom and tops multiple times.
Bitcoin channels over the past six months (TradingView)
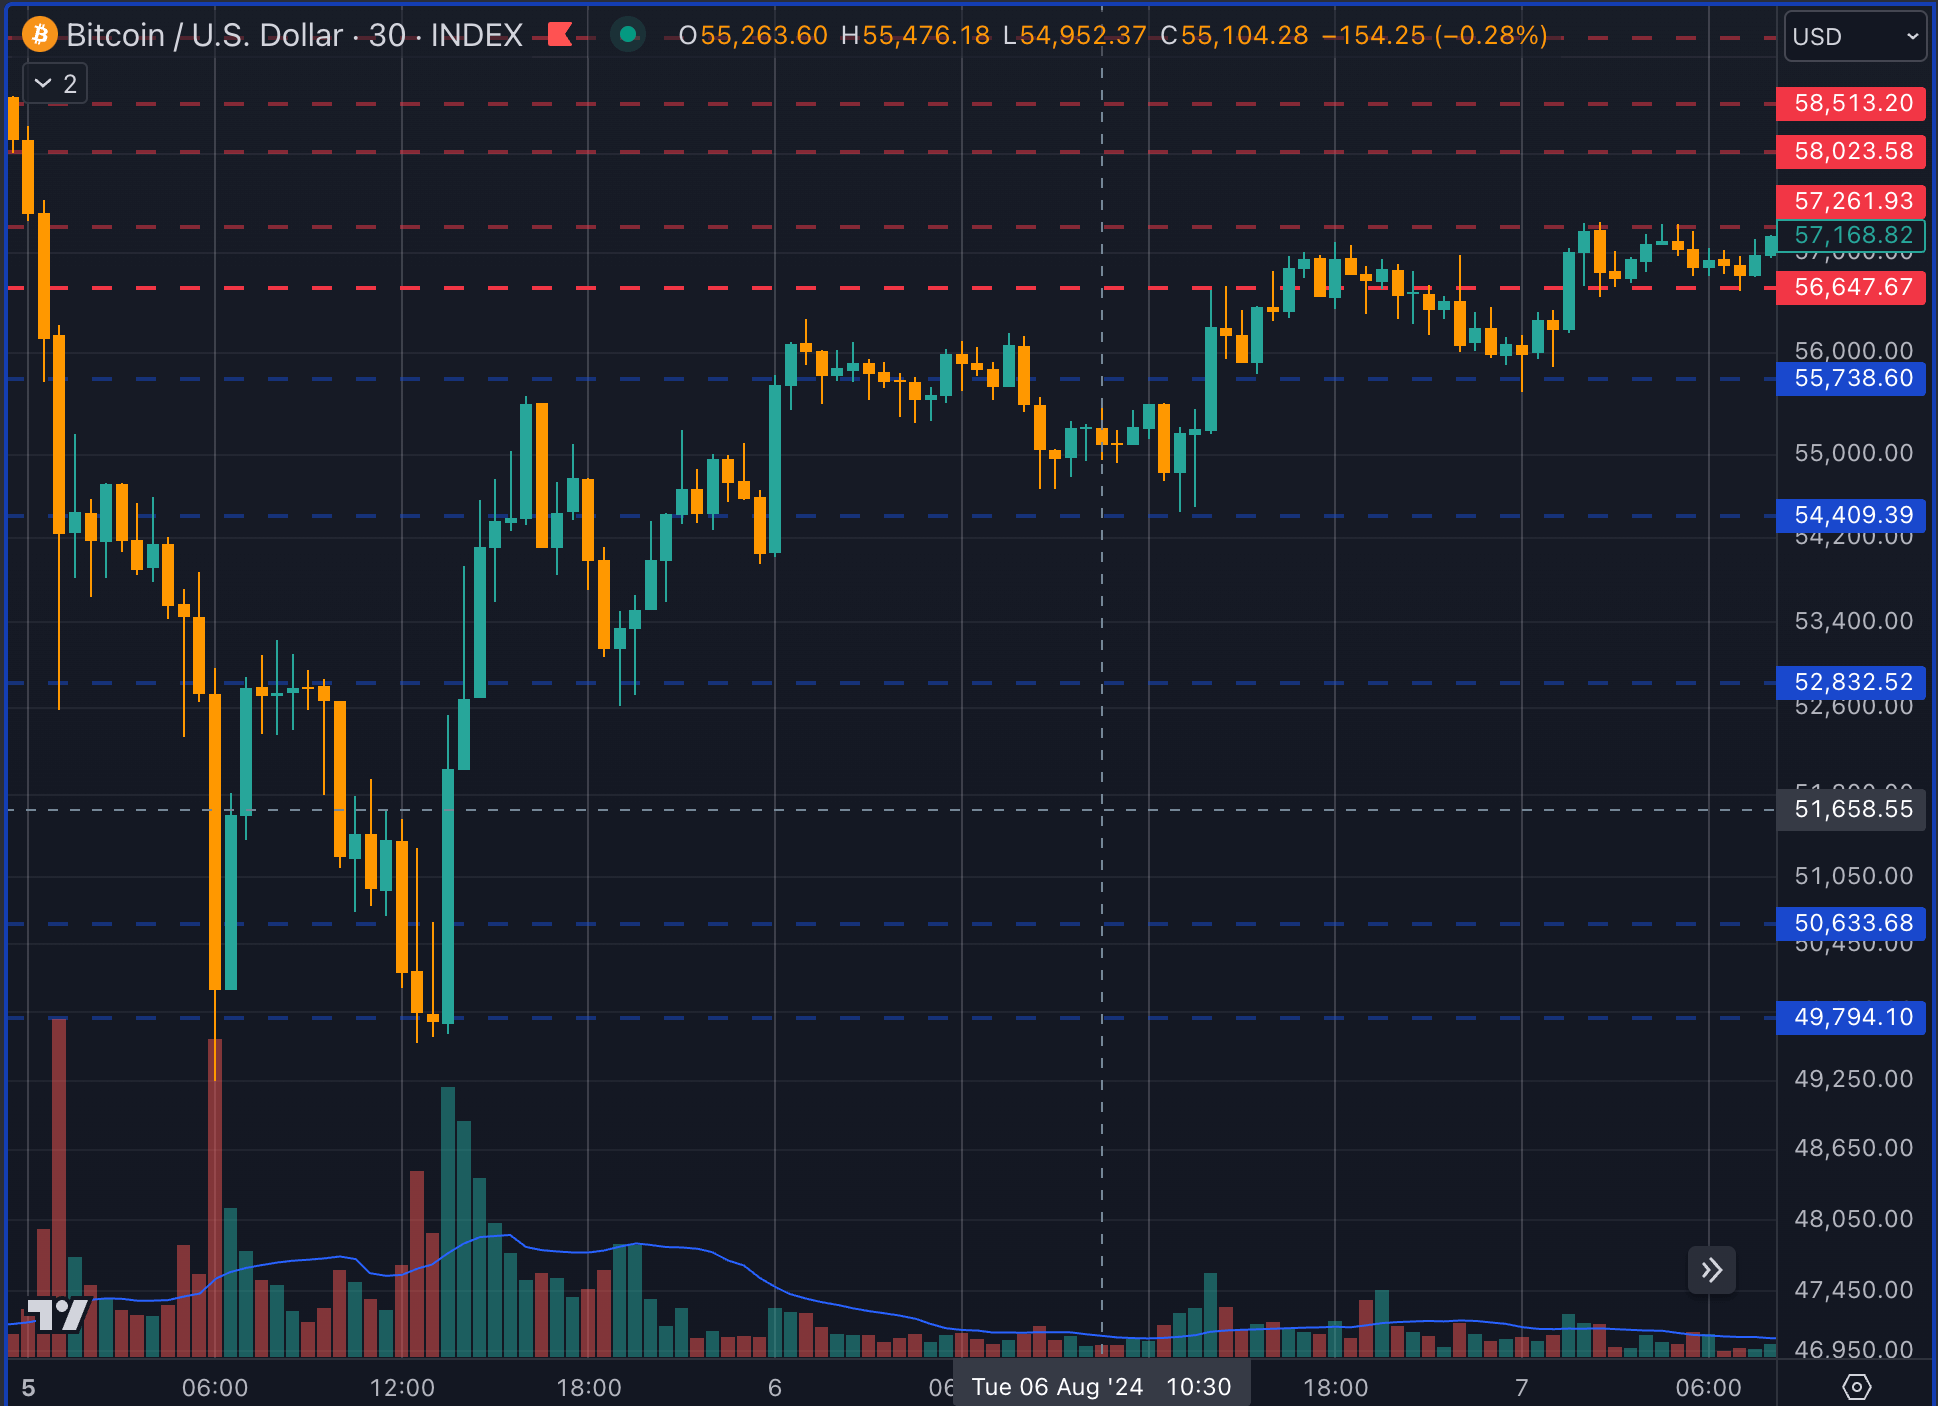
Further, Bitcoin's drop to $49,000 lined up perfectly with the last line of my bottom channel. I postulated that a fall below this price would open up new lower price discovery, opening up the possibility of new lower prices. However, Bitcoin bounced off the bottom channel before hitting resistance at the top of the channel.
Bitcoin bottom channel (TradingView)
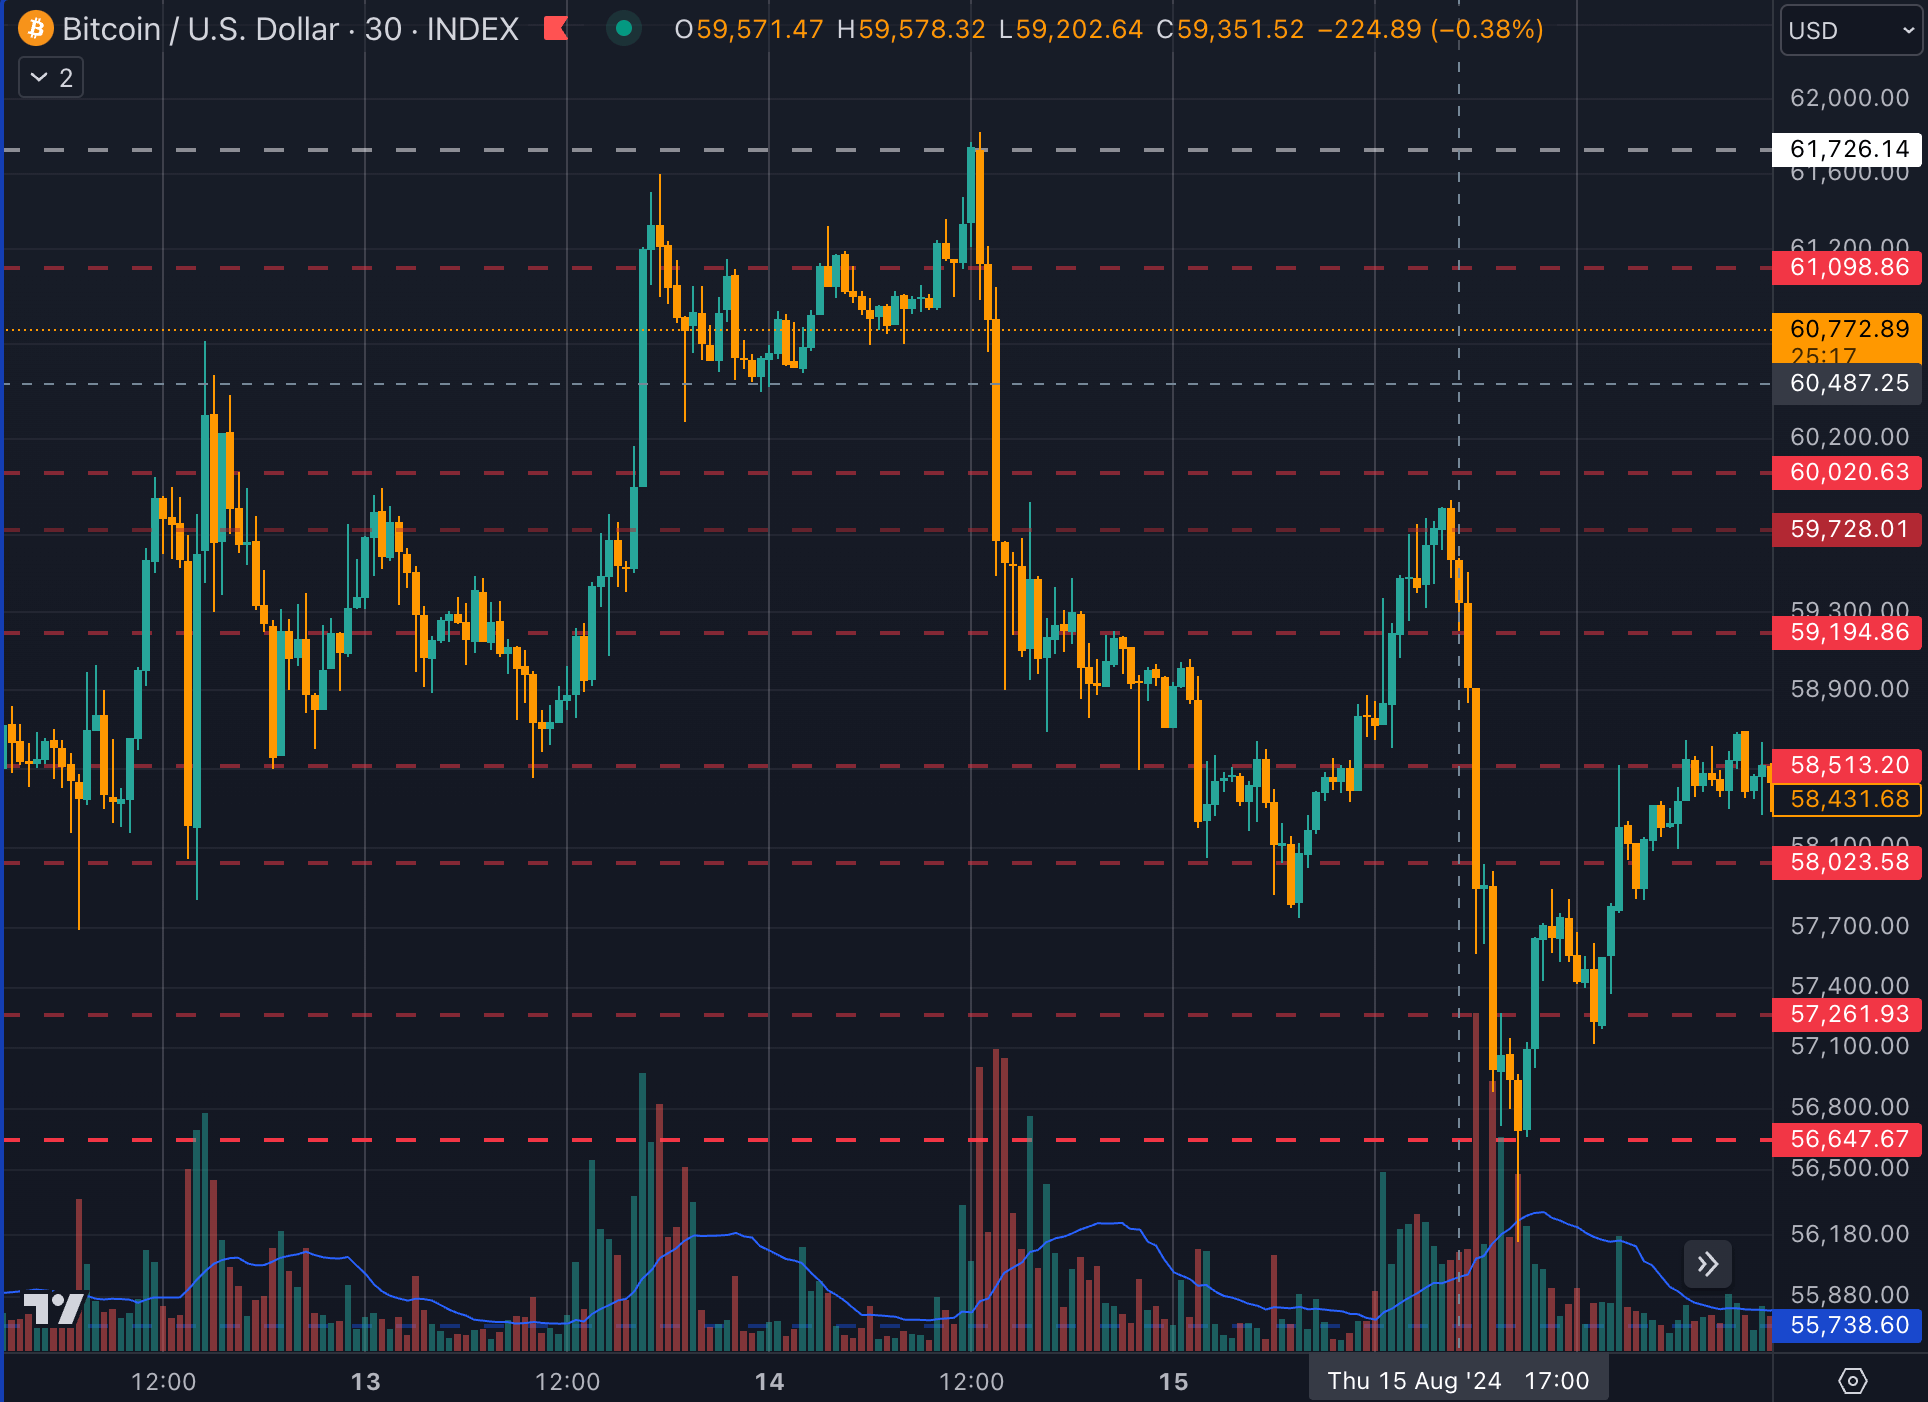
Between Aug. 12 and Aug. 16, Bitcoin bounced off the bottom of the white channel before falling to the bottom of the red channel, where it again found support.
Bitcoin bouncing off top of the white channel (TradingView)
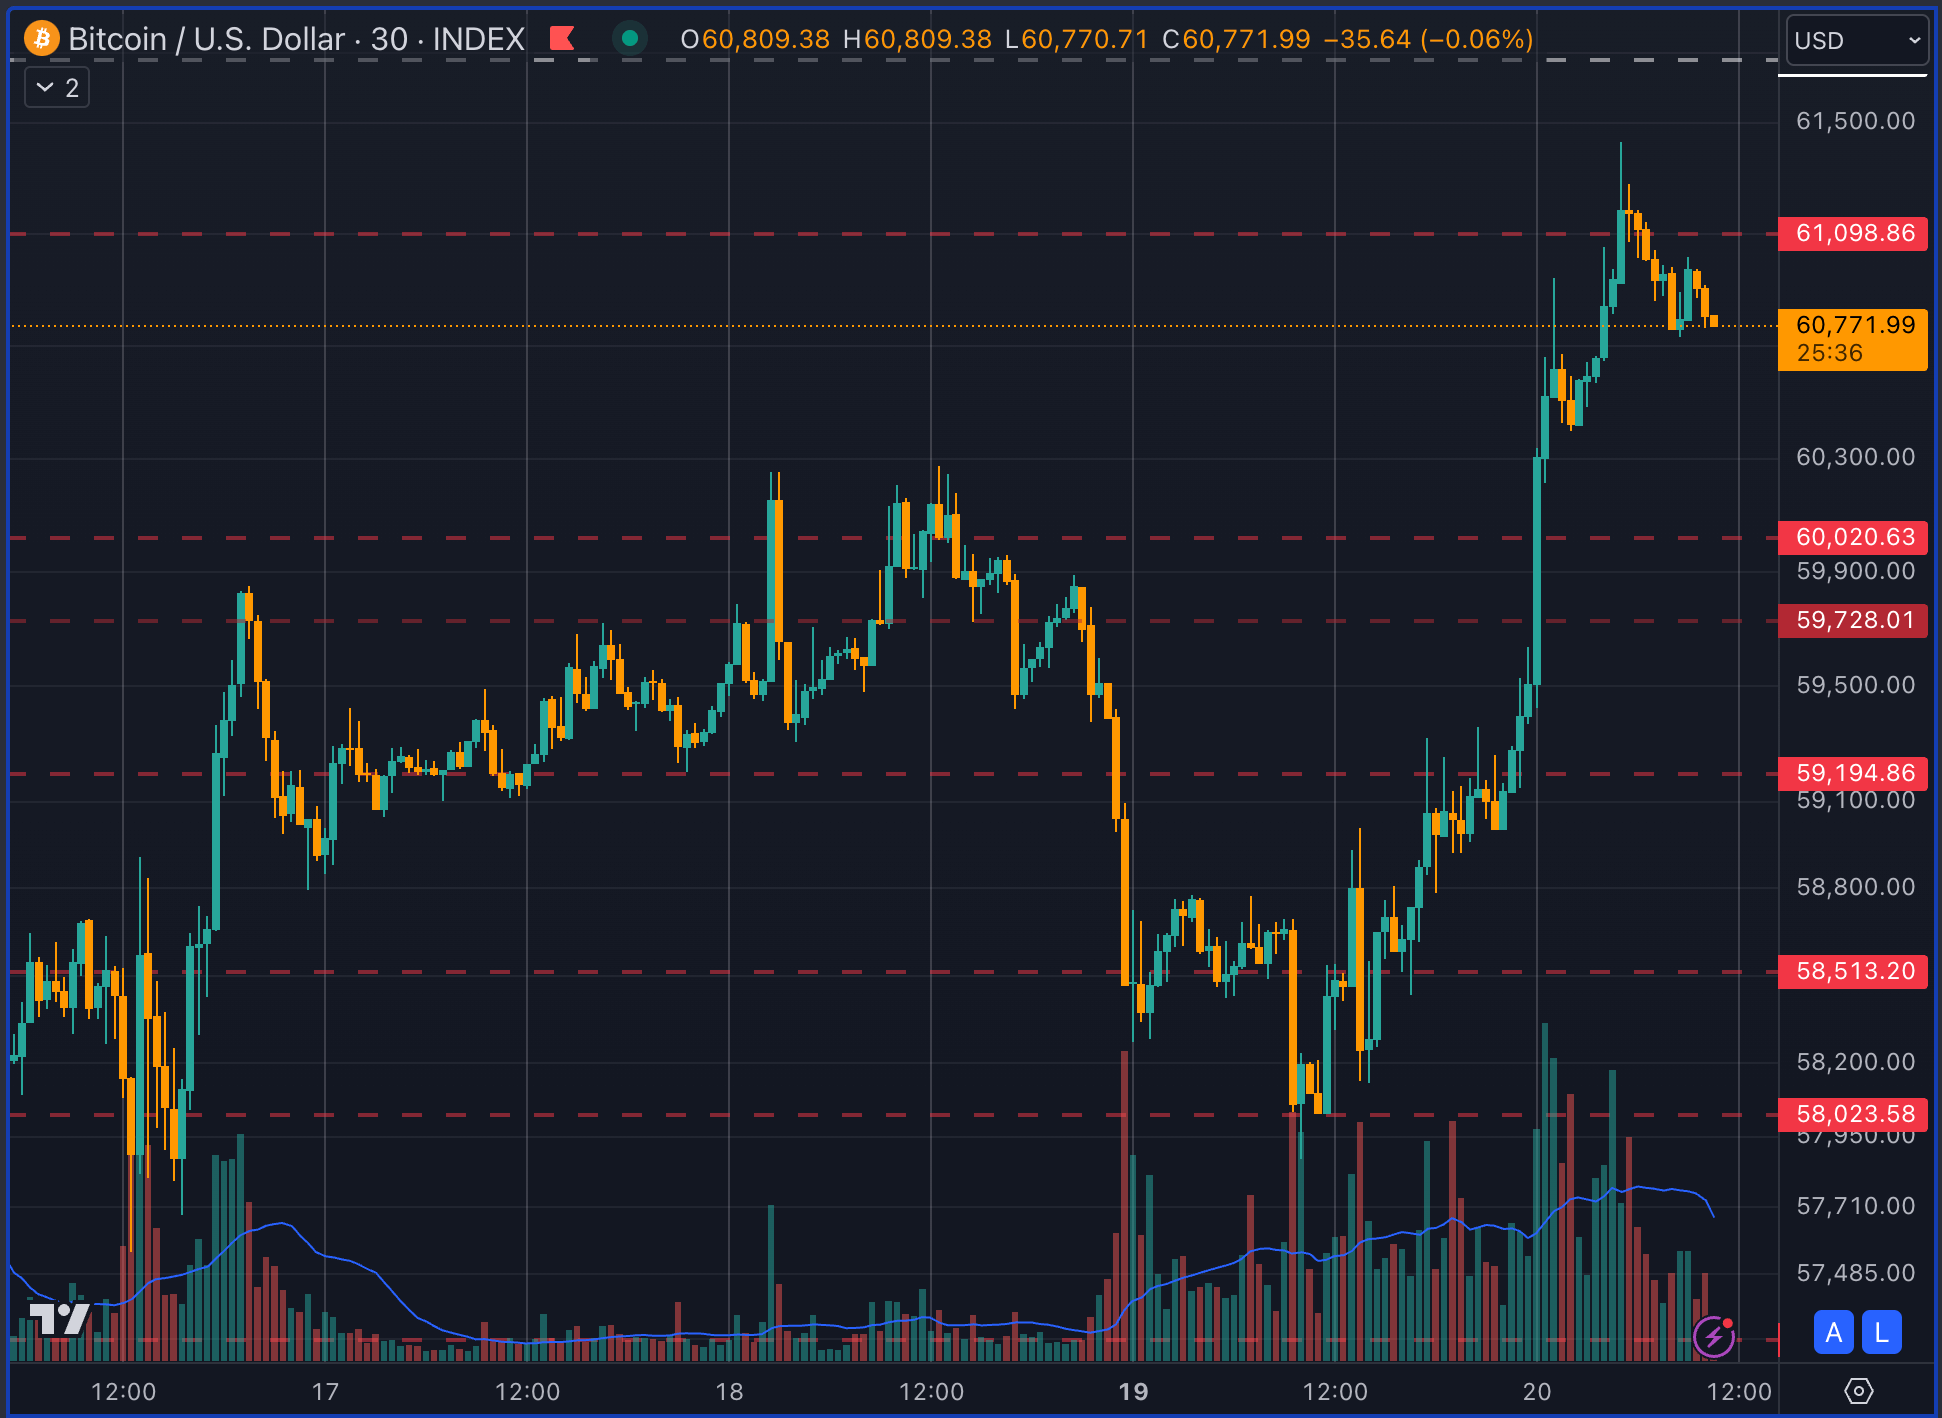
Currently, Bitcoin has shown strength, rebounding to the top of the red area, which is the second bottom channel in the analysis. Bitcoin wicked above the red, threatening to enter the white before failing a retest of the top of the channel at $61k, potentially returning to the next level at $60k.
CryptoSlate Daily Brief
Daily signals, zero noise.
Market-moving headlines and context delivered every morning in one tight read.
5-minute digest 100k+ readers
Free. No spam. Unsubscribe any time.
Whoops, looks like there was a problem. Please try again.
You’re subscribed. Welcome aboard.
Current Bitcoin price action (TradingView)
While I do not believe in trading using technical analysis, many others do. As a result, I see the value in identifying areas wherein other traders will place orders to estimate where to expect market reversals. Ultimately, charting is only a minor factor in determining Bitcoin price alongside regulation, geopolitical events, the economic climate, social sentiment, and on-chain transactions.
I do not claim to be able to predict Bitcoin prices daily. However, these channels have been highly influential in determining how much pressure Bitcoin needs to pass certain price levels, either up or down.
For instance, at present, sizeable Bitcoin FUD caused by institutions moving large amounts of Bitcoin on-chain will need considerable social sentiment pressure to pull Bitcoin below $56.6k. Likewise, bullish sentiment caused by cutting rates or increasing market liquidity would need to be substantial to push through $66.8k to break into the top yellow channel.
I post about this analysis on the on-chain social media platform Lens Protocol, along with new SlateCast episodes, on the official CryptoSlate account. None of this analysis should be considered personal financial advice; as mentioned earlier, I do not trade off these levels myself. I believe in buying Bitcoin regularly and consistently at whatever price it is on that day.
Bitcoin Market Data
At the time of press 12:21 pm UTC on Aug. 20, 2024, Bitcoin is ranked #1 by market cap and the price is up 4.26% over the past 24 hours. Bitcoin has a market capitalization of $1.2 trillion with a 24-hour trading volume of $27.95 billion. Learn more about Bitcoin ›
At the time of press 12:21 pm UTC on Aug. 20, 2024, the total crypto market is valued at at $2.14 trillion with a 24-hour volume of $62.22 billion. Bitcoin dominance is currently at 56.02%. Learn more about the crypto market ›