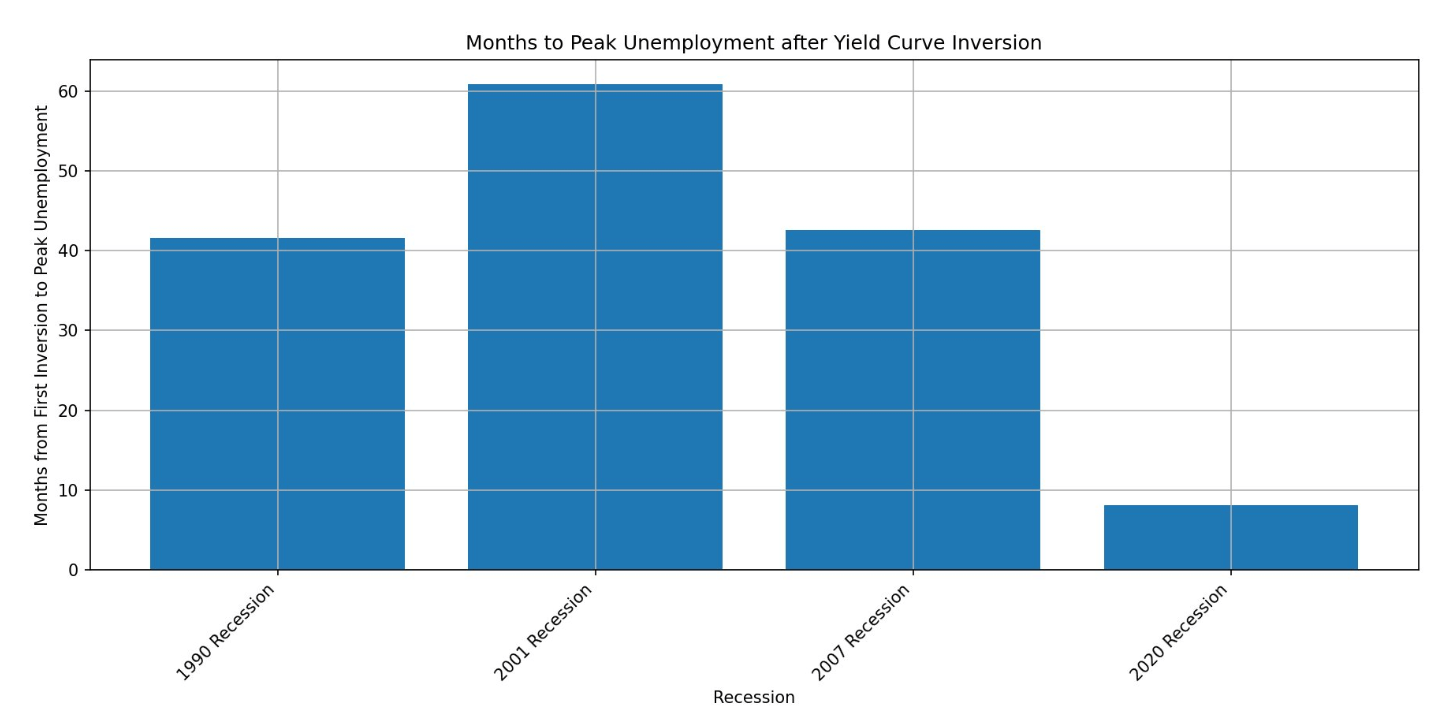
Based on historical data from the past three recessions (excluding the effects of COVID-19), peak unemployment can take up to 40 months or longer to manifest following the initial inversion of the yield curve.
The yield curve used for this analysis is the difference between the 10-year and 2-year U.S. Treasury yields (US10Y – US02Y).
This particular yield curve has been recognized as an accurate predictor of recessions for the past fifty years. Its initial inversion in April 2022 indicated that assuming historical patterns hold true, the peak of unemployment may not be realized until 2025.
Unemployment in the United States is currently at 3.6%, one of the lowest levels for 40 years.