



Tokenization
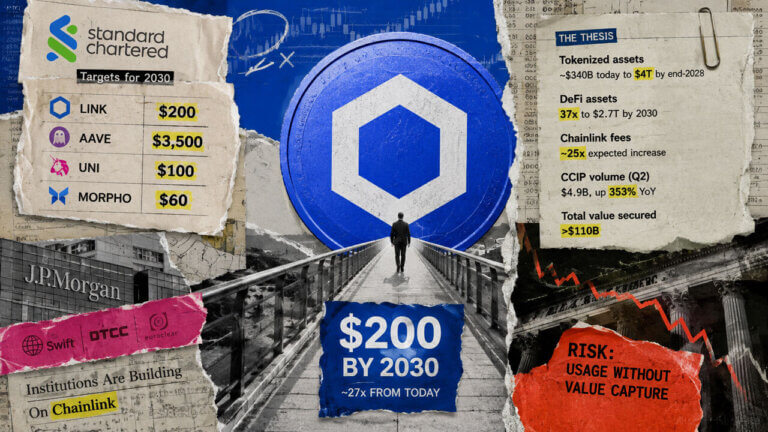
LINK could be next in line after Standard Chartered’s UNI and AAVE targets sparked sharp repricings
Standard Chartered’s $200 LINK target puts Chainlink into the same setup that saw traders rapidly reprice UNI and AAVE.

$223.04M traded Price signal supported
Trading Activity price-reliability indicator with 100 percent data coverage. Low activity replaces price-derived sentiment because the displayed market price may not be supported by meaningful trading.Target
Peg Health price-stability indicator with 0 percent data coverage. It measures observed market pricing, not reserve quality or redemption safety.30D -6.5% 77.1% below ATH
Price-based current market conditions indicator with 100 percent data coverage. This is not a price forecast.$223,036,636.84 traded over the last 24 hours. The available activity evidence is sufficient to retain the asset’s price-derived signal.
Low activity can make the displayed price sensitive to a handful of trades. Trading Activity assesses price reliability—not project development, legal status, reserves, or solvency.
Price movement Not interpreted while trading support is below the reliability threshold.
What it measures
The model combines reported 24-hour volume, market-cap turnover, valid-pair liquidity, active exchange breadth, and quote freshness. Missing optional evidence lowers coverage; missing volume or a known-stale quote suppresses price-derived interpretation.
Configured model weights
When inputs are missing, these configured weights are renormalized across the available evidence; data coverage records what is missing.
How to read it
Scores of 0–19 are dormant, 20–39 are thin, 40–69 are supported, and 70–100 are active. Scores below 40 withhold price-derived interpretation.
Logarithmic historical position supports it. The available evidence produces a price-neutral reading rather than a price forecast.
A complete ATL and ATH range is not available for this asset.
What it measures
The model converts price momentum, logarithmic historical position, milestone recency, and short-term volume confirmation into one 0–100 score. Missing evidence lowers data coverage instead of counting as neutral.
Configured model weights
When inputs are missing, these configured weights are renormalized across the available evidence; data coverage records what is missing.
How to read it
50 is the neutral midpoint. Scores of 60 or higher are bullish, 40 or lower are bearish, and 41–59 are neutral.
Showing 10 spot markets sorted by CoinMarketCap exchange rank. Markets excluded from CMC price or volume calculations are hidden.
| Pair | |||||
|---|---|---|---|---|---|
| 1 | LINK/USDT | $12.18 | $17.29M | 745 | |
| 2 | LINK/USD | $12.19 | $5.07M | 667 | |
| 3 | LINK/KRW | $12.27 | $2.47M | 498 | |
| 4 | LINK/USDT | $12.17 | $3.63M | 651 | |
| 5 | LINK/USDC | $12.16 Best price | $657.51K | 588 | |
| 6 | LINK/USDT | $12.17 | $15.65M | 559 | |
| 7 | LINK/USDT | $12.18 | $1.51M | 663 | |
| 8 | LINK/USDT | $12.18 | $7.3M | 677 | |
| 9 | LINK/USDT | $12.18 | $16.17M | 684 | |
| 10 | Uniswap v3 (Ethereum) | LINK/WETH | $12.17 | $788.48K | 589 |
Affiliate Disclaimer: CryptoSlate may receive a commission when you click trading links on this page and complete an action with a third party. This does not influence our editorial independence or coverage.
Standard Chartered’s $200 LINK target puts Chainlink into the same setup that saw traders rapidly reprice UNI and AAVE.
Security concerns are driving projects toward CCIP while Chainlink expands into tokenized funds, collateral and foreign-exchange settlement.
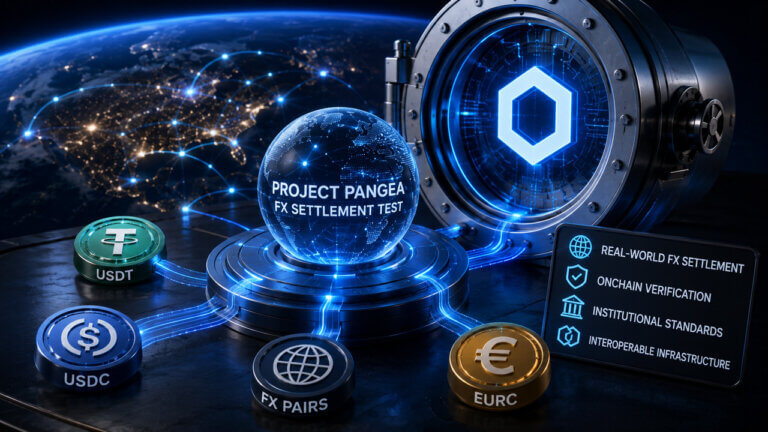
The framework targets T+0 payment-versus-payment settlement while keeping banks on familiar Swift and ISO 20022 workflows.

Kraken is rebuilding how Bitcoin moves through DeFi after the KelpDAO shock.
See LINK across major fiat currencies and swap the active converter instantly.
Quick SelectUsing the live USD market price. Additional fiat rates will appear after the daily sync.
Chainlink is the industry-standard oracle platform bringing the capital markets onchain and powering the majority of decentralized finance (DeFi). Chainlink stands to benefit the most from emerging blockchain-industry trends, such as stablecoin adoption, real-world asset tokenization, and institutional adoption of blockchain technology. Chainlink is powered by the LINK token, which is used to pay for platform services and secure the network’s proper functioning. Chainlink leverages a novel fee model where offchain and onchain revenue from enterprise adoption is converted to LINK tokens and stored in a strategic Chainlink Reserve.
Chainlink is at the forefront of financial innovation and the global tokenization trend. Traditional financial institutions and infrastructures, such as Swift, DTCC, Euroclear, J.P. Morgan, Mastercard, Central Bank of Brazil, UBS, SBI, Fidelity International, ANZ, and many others are adopting Chainlink as fundamental infrastructure as they move toward tokenizing trillions onchain. Demand for Chainlink has already generated hundreds of millions of dollars in revenue across a variety of traditional and decentralized use cases.

Chainlink is the only all-in-one platform that fulfills the requirements of any institutional blockchain use case. The Chainlink platform enables developers and institutions to access all the critical data, interoperability, compute, compliance, privacy, and legacy-system connectivity required for advanced blockchain applications that link the onchain and offchain worlds. Chainlink solves four fundamental problems for institutions interacting with tokenized assets:
The data problem. Tokenized assets need real-world information to be usable in transactions, such as market pricing, reference data, and proof of reserves data. Chainlink is the market leader in bringing real-world data onchain securely and accurately.
The liquidity problem. Financial institutions need tokenized assets that can be securely accessed and moved across blockchain networks in order to maximize liquidity. Chainlink CCIP is the only cross-chain interoperability standard that securely connects any public or private blockchain, opening up global markets for tokenized assets.
The synchronization problem. Tokenized assets must remain synchronized with legacy systems once issued across multiple chains. Chainlink is the only platform that offers reliable offchain data, system connectivity, and secure cross-chain interoperability, enabling a Unified Golden Record that stays with assets anywhere.
The compliance problem. Regulated institutions require compliance enforcement capabilities such as identity verification (KYC), risk screening (AML), exploit protection, and asset-specific restrictions. The Chainlink Automated Compliance Engine extends existing financial infrastructure for identity and compliance data to blockchains and tokenized assets.
Since launch, the Chainlink standard has securely enabled tens of trillions in transaction value across dozens of blockchains and published tens of billions of verified messages onchain. Chainlink actively secures the large majority of DeFi protocols across different blockchains, with near total dominance on Ethereum. As a chain-agnostic platform with thousands of users across the world’s largest financial institutions and DeFi protocols, Chainlink accelerates the adoption of blockchain ecosystems and is used by tens of thousands of developers, including protocols such as Aave, GMX, Lido, and many more.


Chainlink launched its token sale on Sep 19, 2017, completed it on Oct 19, 2017, raised $32MM USD from 2649 contributors.
SmartContract is a blockchain technology company that provides secure, scalable, and automated solutions for decentralized applications and digital asset management.
As of Oct 23, 2026, Chainlink trades at $12.13.
Chainlink has a market capitalization of $9,074,410,364.38.
Chainlink has a 24-hour trading volume of $223,036,636.84.
Chainlink reached an all-time high of $52.88, recorded on May 10, 2021. It is currently 77.06% below its all-time high.
Chainlink recorded an all-time low of $0.13, recorded on Sep 23, 2017. It is currently 9.5 thousand percent above its all-time low.