Quick Take
- Coin Metrics' modeled $1,000 comparisons leave 1 basis point before fees in one case and negative 15 in another.
- Bitquery's corrected historical prices account for shares and dividends.
- Issuer onboarding, whitelisted wallets and route-specific costs affect how holders can turn Nvidia token price gaps into executable trades.


Tokens tracking Nvidia shares can trade at different prices across issuers and exchanges, but buying the cheaper version and selling a dearer one leaves little room for profit in two modeled comparisons published by data provider Coin Metrics on Nov. 3.
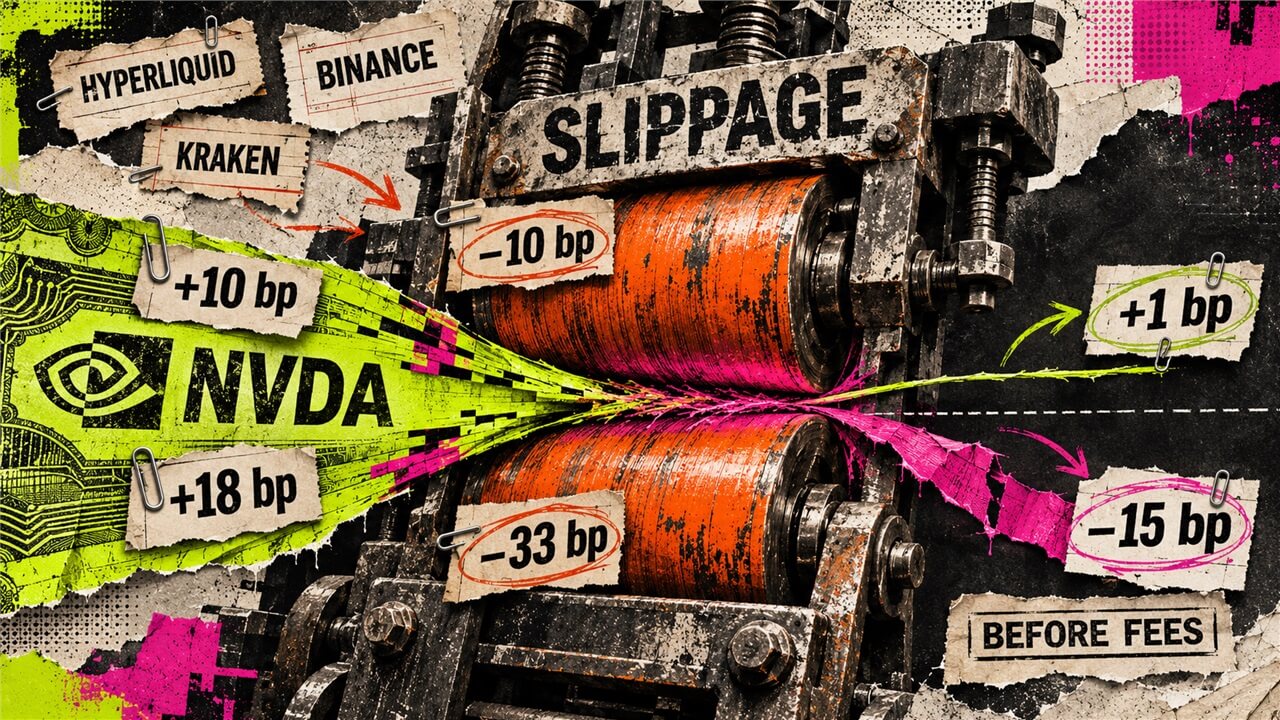
The data provider's execution study shows about one basis point remaining in one $1,000 comparison after entry and exit slippage, and a negative 15 basis points in another.
The results show how a visible price difference can shrink when an order reaches the market, while preserving a small positive remainder in the first example.
A holder must compare the same share exposure, have something to sell on the expensive side, and qualify for the route used to settle the trade.
Coin Metrics' spread and slippage chart compares buying Hyperliquid NVDAx with selling Binance NVDAb, printing a gross gap of 10 basis points, entry and exit slippage of 10 basis points, and a one-basis-point remainder before trading fees.
Its second comparison buys Hyperliquid NVDAx and sells Kraken NVDAx. There, an 18-basis-point gross gap faces 33 basis points of entry and exit slippage, leaving a negative 15-basis-point gap before fees.
The price gap shrinks at execution
Two $1,000 modeled comparisons. June–Nov. 2, 2026 data; published Nov. 3. Trading fees are excluded.
One comparison retains only 1 basis point before fees; the other is already negative.
- Coin Metrics published its Nvidia token execution analysis on November 3, 2026; its spread/slippage section covers June 2026 through November 2, whereas its recent premium and venue-ranking observations cover October 27 through November 2. Coin Metrics / Talos, Nov. 3 execution study
- Coin Metrics' $1,000-notional chart labels a cross-wrapper comparison 'buy Hyperliquid NVDAx / sell Binance NVDAb': gross spread +10 basis points, entry-plus-exit slippage −10 basis points, and a remaining 1 basis point before trading fees, as printed and rounded. Coin Metrics / Talos, Nov. 3 execution study Publisher chart: Spread and Slippage Costs
- Coin Metrics' $1,000-notional chart labels a cross-exchange comparison 'buy Hyperliquid NVDAx / sell Kraken NVDAx': gross spread +18 basis points, entry-plus-exit slippage −33 basis points, and −15 basis points before trading fees. Coin Metrics / Talos, Nov. 3 execution study Publisher chart: Spread and Slippage Costs
- The Coin Metrics chart supports almost no remaining edge in its first example and a negative remainder in its second, before trading fees; it does not establish simultaneous executable quotes, realized profit, or a universal absence of opportunities. Coin Metrics / Talos, Nov. 3 execution study Publisher chart: Spread and Slippage Costs
Historical modeled results, before trading fees, not live quotes or realized returns. Labels are rounded independently; +10 and −10 do not sum to the printed +1. Exact contract mapping and all-in execution conditions are unverified.
Method: Replot literal publisher labels on matching −20 to +20 basis-point axes. Arrows connect each reported gross gap to its reported before-fee remainder, not a time series. Printed slippage and results are rounded independently; no raw data or inferred bar heights are used.
Tokenized-equity framework xStocks announced NVDAx/USDC spot trading on HyperCore on Aug. 10, separately from equity perpetuals. Moving those spot tokens to or from HyperEVM involves wrapping and bridging.
The chart's venue labels alone do not establish that transfer route for every observation in its June-November sample.
One stock, different routes
A second dataset shows why even a clean-looking price comparison needs adjustment. In a Nov. 1 correction, Bitquery normalized its Nvidia tokens per underlying share and adjusted dividend treatment.
Across its Sept. 15-Oct. 13 public-pool sample, pairwise median daily gaps among the four busiest versions rounded to no more than 0.12%. The widest pair was 0.1225%, rounded to 0.12%.
Kraken's multiplier explanation shows that dividend reinvestment can increase the share exposure displayed in an xStock balance while the number of on-chain tokens stays unchanged. For wrapped xStocks, the issuer separately says token prices must be adjusted using its multiplier.
Bitquery says their Nvidia tokens have separate contracts without a direct bridge or issuer swap between them, so buying the cheaper product does not supply the different token needed for the sale.
Kraken's Oct. 30 FAQ lists a 10-basis-point taker fee and a two-basis-point maker rebate for its Pro spot order book. App purchases using US dollars or USDG have no trading fee but may include a spread, while xStock conversions carry a 1% fee.
The issuer's primary-market documentation requires onboarding, identity and anti-money-laundering checks, and whitelisted wallets. Its named cash Market Flow lists a $5,000 minimum, 24/5 availability, and fees currently set to zero.
Kraken also excludes US persons and customers in the US, UK, Canada, and Australia from xStocks access. Compatible-wallet withdrawals are supported, but transfers into a traditional brokerage account are not. The issuer classifies xStocks as tracker certificates providing economic exposure, without direct share ownership or voting rights.
The usable margin depends on executable prices for matching exposure, both legs' costs, and the ability to deliver or sell the relevant instrument.
Mentioned in this article


Editorial credits