

Quick Take
- Bitcoin’s Q2 correlation with the S&P 500 and Nasdaq fell, while its link to gold and silver rose.
- That shift means Q3 Bitcoin now hinges on real yields, the dollar and Fed policy, not just AI-stock weakness.
- The key risk is whether an AI selloff lowers rates and the dollar, or keeps inflation sticky and drags Bitcoin lower too.


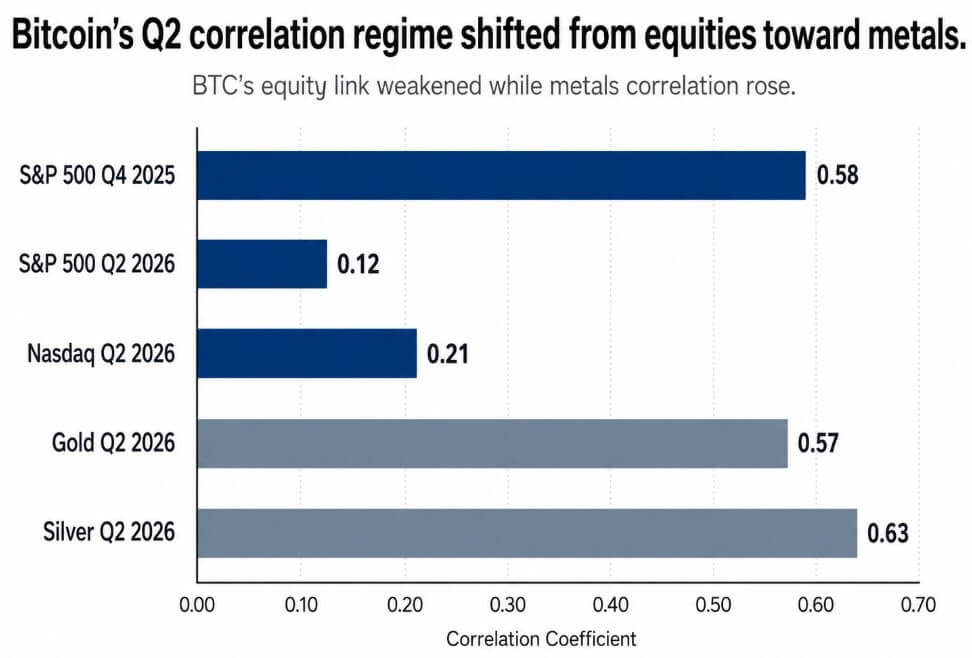
Bitcoin's daily correlation with the S&P 500 fell to 0.12 during the second quarter, down from 0.58 in the fourth quarter of 2025, according to a joint report from Coinbase Institutional and Glassnode covering data through June 30.
Its correlation with the Nasdaq sat at 0.21 over the same window, and gold moved in the opposite direction. Bitcoin's correlation with the metal climbed to 0.57, and its correlation with silver reached 0.63.
That reversal separates Bitcoin from the AI-driven equity trade that carried much of crypto's price action over the past two years, arriving as the Federal Reserve meets July 28-29, Microsoft and Meta report earnings July 29, and Amazon reports July 30.
Hyperscaler capital-spending guidance and the Fed's rate decision arrive in the same week, inside the quarter Bitcoin just entered.
Colin Basco of Coinbase Institutional and Glassnode's analyst team read the current phase the same way, describing a move from correction toward accumulation and pointing to on-chain data showing coins that last transacted within three months sitting at multi-year lows.
They also found a climb in dormant supply, which, along with the on-chain data presented, represents a pattern that has historically appeared during accumulation phases.
A shared macro channel
The report frames the second-quarter gold link by pointing to a firmer dollar and a hawkish Fed that weighed on both Bitcoin and gold, pulling them down together.
Bitcoin and gold sold off in tandem because both answer to the same real-rate and liquidity forces that have set Bitcoin's price all year.
That framing changes what an AI-stock selloff can do for Bitcoin heading into the third quarter. Money leaving expensive technology shares helps Bitcoin only when it also pushes Treasury yields lower and weakens the dollar.
An unwind driven by inflation, tariffs, or energy costs tightens the same channel that already dragged Bitcoin down in the second quarter, along with gold.
Alphabet raised its 2026 capital-expenditure guidance to $195 billion-$205 billion on July 22, up from $180 billion-$190 billion, and reported its first negative free-cash-flow quarter, burning $5.9 billion.
The four largest US hyperscalers, Microsoft, Alphabet, Amazon and Meta, could collectively spend more on capex than they generate in free cash flow by 2027 if current spending continues.
Big Tech is on pace to spend over $700 billion this year on AI infrastructure, and Morgan Stanley projects more than $1 trillion next year.
New York Fed President John Williams tied elevated inflation to tariffs, Middle East-driven energy and commodity costs, and demand for goods and electricity that technology investment has driven, naming semiconductors and power transformers specifically.
The Fed's July Monetary Policy Report listed PCE inflation at 4.1% and core PCE at 3.4% over the twelve months through May, and the Fed has held the funds rate at 3.50%-3.75% since the start of the year.
June's Summary of Economic Projections lifted the 2026 median PCE forecast to 3.6% and the year-end funds-rate median to 3.8%, up from 3.4% in March.
Two versions of the same selloff
In the bull case, AI shares fall because investors reject stretched valuations or demand visible returns on capital they have already committed.
Treasury yields decline, the dollar softens, and capital rotates toward scarce assets. Bitcoin rises alongside gold and silver, staying detached from technology equities as its climbing correlation with metals turns into a new source of demand.
In the bear case, AI shares fall because oil, tariffs and infrastructure demand keep inflation stubborn, pushing yields and the dollar up. Expensive technology stocks, metals and Bitcoin can all decline together under those conditions.
Bitcoin's price answers to the real-rate channel now, the same lever pulling gold and silver lower. A shared correlation with gold offers no protection when both assets face the same higher cost of money.
| AI selloff type | Why tech falls | Rates / dollar reaction | Metals reaction | Bitcoin implication |
|---|---|---|---|---|
| Bullish for BTC | Investors reject stretched AI valuations or demand clearer return on capex | Treasury yields fall; dollar weakens | Gold and silver gain as scarce assets | BTC can rise with metals while staying detached from Nasdaq |
| Bearish for BTC | Oil, tariffs, power demand and AI infrastructure costs keep inflation sticky. | Treasury yields rise; dollar strengthens | Metals struggle despite inflation risk | BTC falls with metals as real-rate pressure dominates |
| Neutral / lagging risk | AI earnings justify capex and tech rebounds | Yields stay firm; dollar does not weaken enough | Metals remain capped | BTC may miss the AI equity rebound while still facing macro pressure |
Oil decides which version plays out
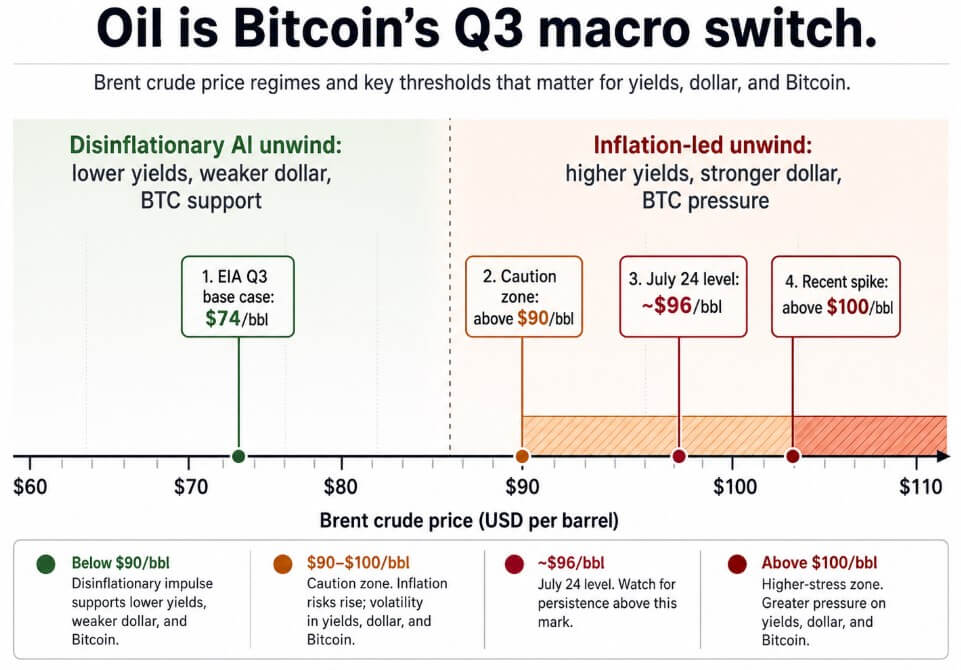
The US Energy Information Administration's July 7 base case put Brent crude averaging $74 per barrel in the third quarter. Brent surged past $100 before slipping to roughly $96 by July 24, the same day the 10-year Treasury yield touched 4.713% and the 30-year sat near a 19-year high.
Gold traded near $4,073 an ounce and silver near $58.77 on July 24, with higher-for-longer rate expectations having capped gold's advance through the year.
The gap between the EIA's forecast and the live price of oil sets the third-quarter test, with a return toward $74 supporting the bull case and sustained prices above $90 keeping the bear case alive.
Bitcoin's ETF flows add a confirmation signal for this quarter, as US spot funds posted net outflows through the first half of the year before that pace showed early signs of exhausting by June.
The funds recorded seven straight days of net inflows through July 22, totaling nearly $1 billion, with the streak ending on July 23 once the spot Bitcoin ETFs bled $225 million.
A short run of inflows confirms demand is stabilizing, and whether that capital traces to an AI-to-crypto rotation will take more than a week of flows to confirm.
Three assumptions under test
Decoupling from the Nasdaq reads as bullish on its face, and it can also mean Bitcoin now answers to a different macro channel than the one investors expect to benefit from. The correlation with gold during a selloff shows shared sensitivity to real yields and the dollar.
Capital leaving technology stocks flows toward crypto only when the unwind is disinflationary. An inflation-led unwind tends to route that capital toward cash, short Treasuries and the dollar.
Portfolio managers holding both metals and Bitcoin face the same test from another direction. A 0.57 correlation with gold limits the diversification benefit Bitcoin offers a portfolio that already holds precious metals. Its edge against equities has strengthened over the same period.
Bitcoin enters the third quarter freed from the assumption that AI weakness automatically becomes crypto strength.
Its path over the next three months turns on whether the AI-stock selloff underway lowers the cost of money or raises it. Oil will answer that before the Fed does, and Bitcoin will trade on whichever direction it takes.

Bitcoin is -3.04% over the past 24 hours and currently sits at rank #1 by market cap.
Mentioned in this article








Editorial credits