
Quick Take
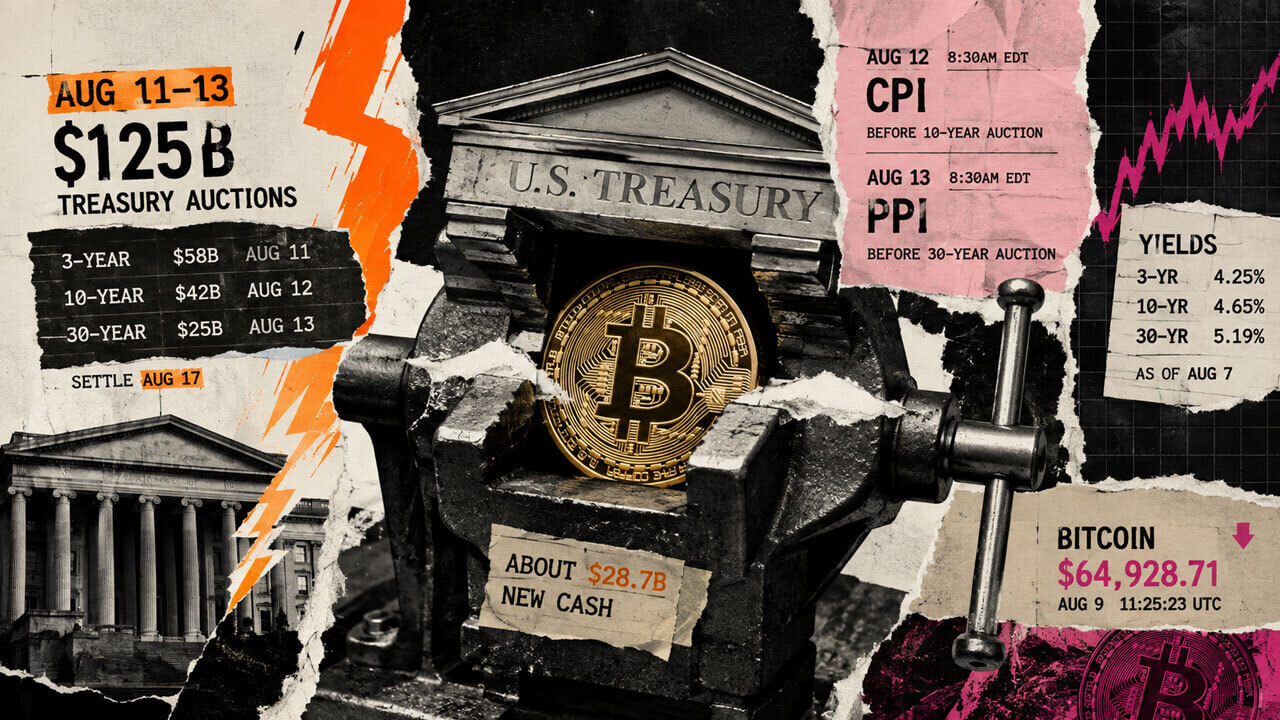
- The Treasury auctions will total $125 billion from Aug. 11 to 13, with all three sales settling Aug. 17.
- July auction results set benchmarks for yields, bid-to-cover ratios, indirect demand, and August comparisons.
- Bitcoin’s risk case is conditional on higher inflation, weaker auctions, elevated yields, and a same-window price drop.


The Treasury auctions will total $125 billion from Aug. 11 through Aug. 13, while two inflation reports land hours before the corresponding 10-year and 30-year sales. The sequence will show whether softer bond demand and any resulting rise in yields coincide with pressure on Bitcoin.
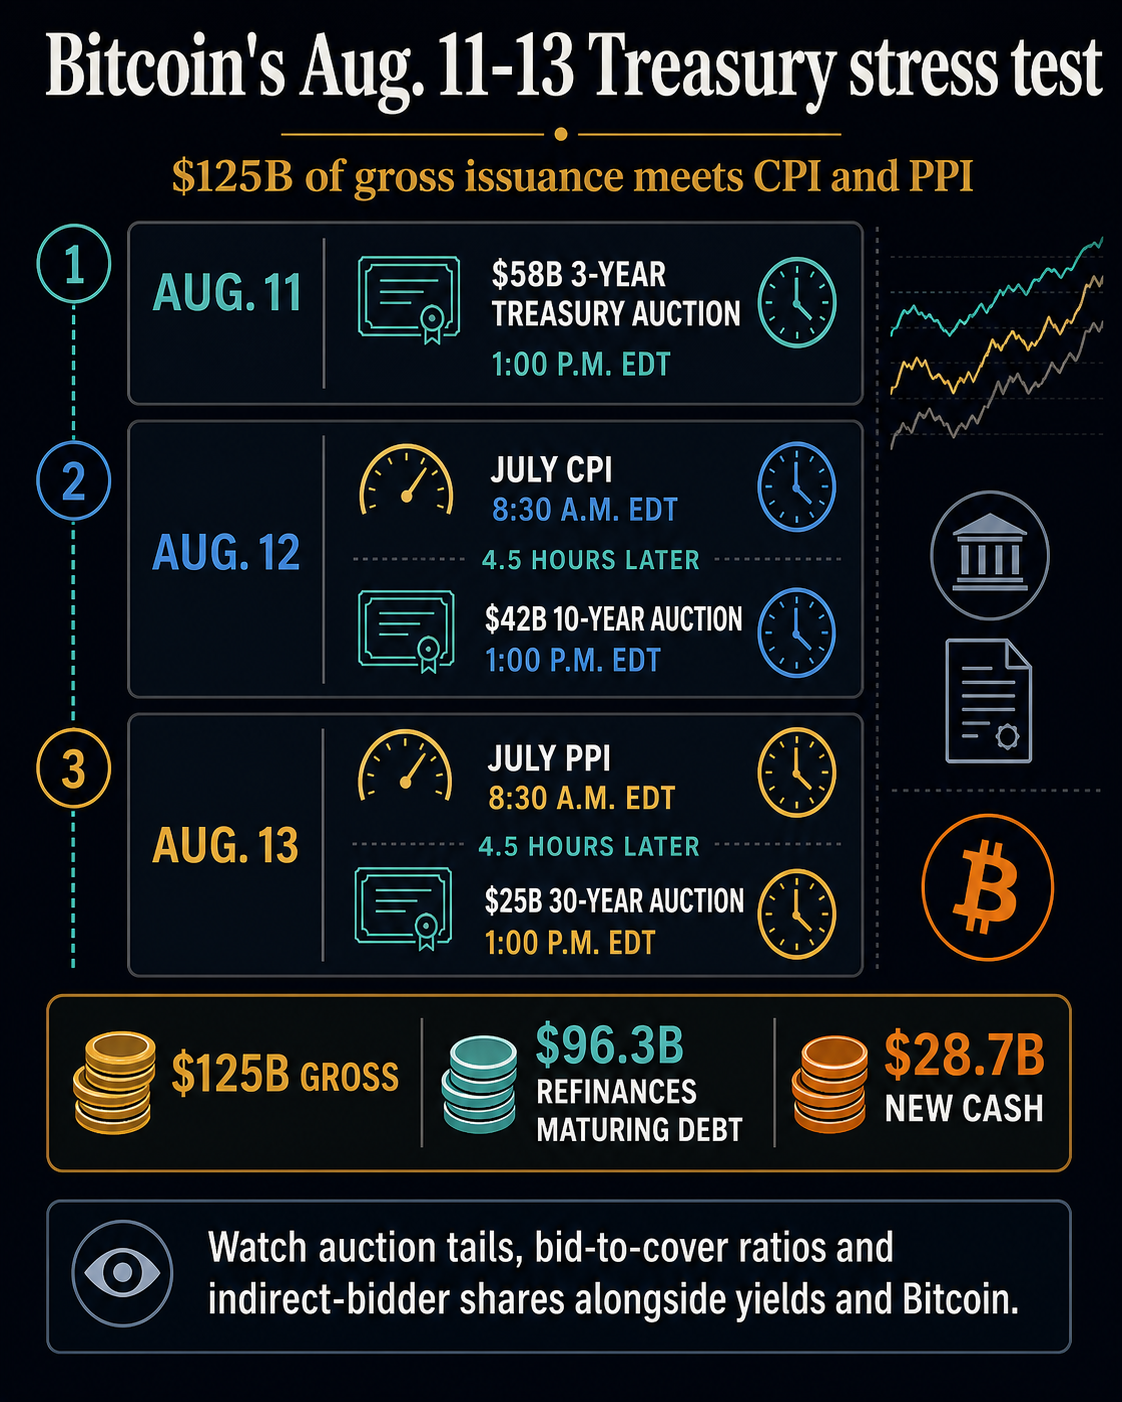
The Treasury refunding plan starts with $58 billion of 3-year notes at 1 p.m. EDT on Aug. 11. It continues with $42 billion of 10-year notes at the same time on Aug. 12 and $25 billion of 30-year bonds on Aug. 13. All three settle Aug. 17.
The gross total is not a $125 billion liquidity drain. About $96.3 billion will refinance privately held debt maturing Aug. 15, leaving approximately $28.7 billion of new cash to raise from investors.
The Bureau of Labor Statistics calendar places July CPI at 8:30 a.m. EDT on Aug. 12, four and a half hours before the 10-year auction. July PPI arrives at 8:30 a.m. the following day, the same interval before the 30-year sale. Together, the releases and Treasury auctions create a tightly timed test of bond demand and Bitcoin’s response.
At the latest official business-day cutoff on Aug. 7, the Treasury's par-yield curve showed 3-year, 10-year and 30-year yields at 4.25%, 4.65% and 5.19%, respectively. A CryptoSlate snapshot retrieved Aug. 9 at 11:25:23 UTC showed Bitcoin at $64,928.71; the live price is timestamp-sensitive.
The Sunday Bitcoin quote and Friday Treasury fixing do not provide simultaneous market evidence. Any link between yields and Bitcoin must be judged around the same inflation releases and auction results.
July sets the demand bar for Treasury auctions
| Tenor | July high yield | Bid-to-cover | Indirect share |
|---|---|---|---|
| 3-year | 4.179% | 2.60 | 67.50% |
| 10-year reopening | 4.580% | 2.59 | 81.49% |
| 30-year reopening | 5.058% | 2.44 | 77.74% |
The July results set a baseline for the August Treasury auctions.
FinancialJuice reported that the July 3-year and 10-year sales stopped through their when-issued yields by 0.6 basis point each, while the 30-year sale stopped through by 0.3 basis point. Treasury does not publish when-issued levels, so the tail comparison is a secondary benchmark rather than an official statistic.
A comparatively weak August result would combine a positive tail with a lower bid-to-cover ratio and lower indirect-bidder share than the matching July sale. One reading alone is not decisive, and auction size plus the July reopening status of the longer securities affect the comparison.
The sharper Bitcoin risk case is conditional: inflation pushes yields higher, several auction metrics point to softer demand, yields remain elevated, and Bitcoin falls in the same event window. Firm auctions or a stable Bitcoin price would weaken that case. New York Fed research found Bitcoin broadly disconnected from monetary and macro news in its historical sample, underscoring why the Treasury auctions should be read as a test of conditions, not an automatic sell signal for Bitcoin.

Bitcoin is +0.76% over the past 24 hours and currently sits at rank #1 by market cap.
Mentioned in this article
Editorial credits